
New On-call in Maple: schedules, escalation and silences.

Traces, logs, errors, replays, uptime, on‑call. One app. Your agent reads it too.

$39/month with 100 GB each of logs, traces and metrics, then $0.30 per GB. No per-host or per-seat fees. Source on GitHub under FSL-1.1, Apache 2.0 after two years.

Start free trial
  • Self-host it on your own infrastructure

    Every line of Maple's source is on GitHub under FSL-1.1, and each release becomes Apache 2.0 after two years. The self-hosted version runs for one team; alerting and team accounts are on Cloud for now.

    Read the source
  • No proprietary agent

    Maple speaks plain OpenTelemetry. Point an OTLP exporter at it and keep the instrumentation you already wrote. If you leave, there is nothing to rip out.

    See instrumentation
  • Hosted in the US or the EU us eu

    Choose the EU when you sign up and your telemetry is stored and processed in Frankfurt. Same plan and price in both regions.

    About EU hosting
  • $39/month, 14-day free trial

    A card is required to start the trial and nothing is charged until it ends. No per-seat, per-host or per-query fees at any volume.

    See what it costs
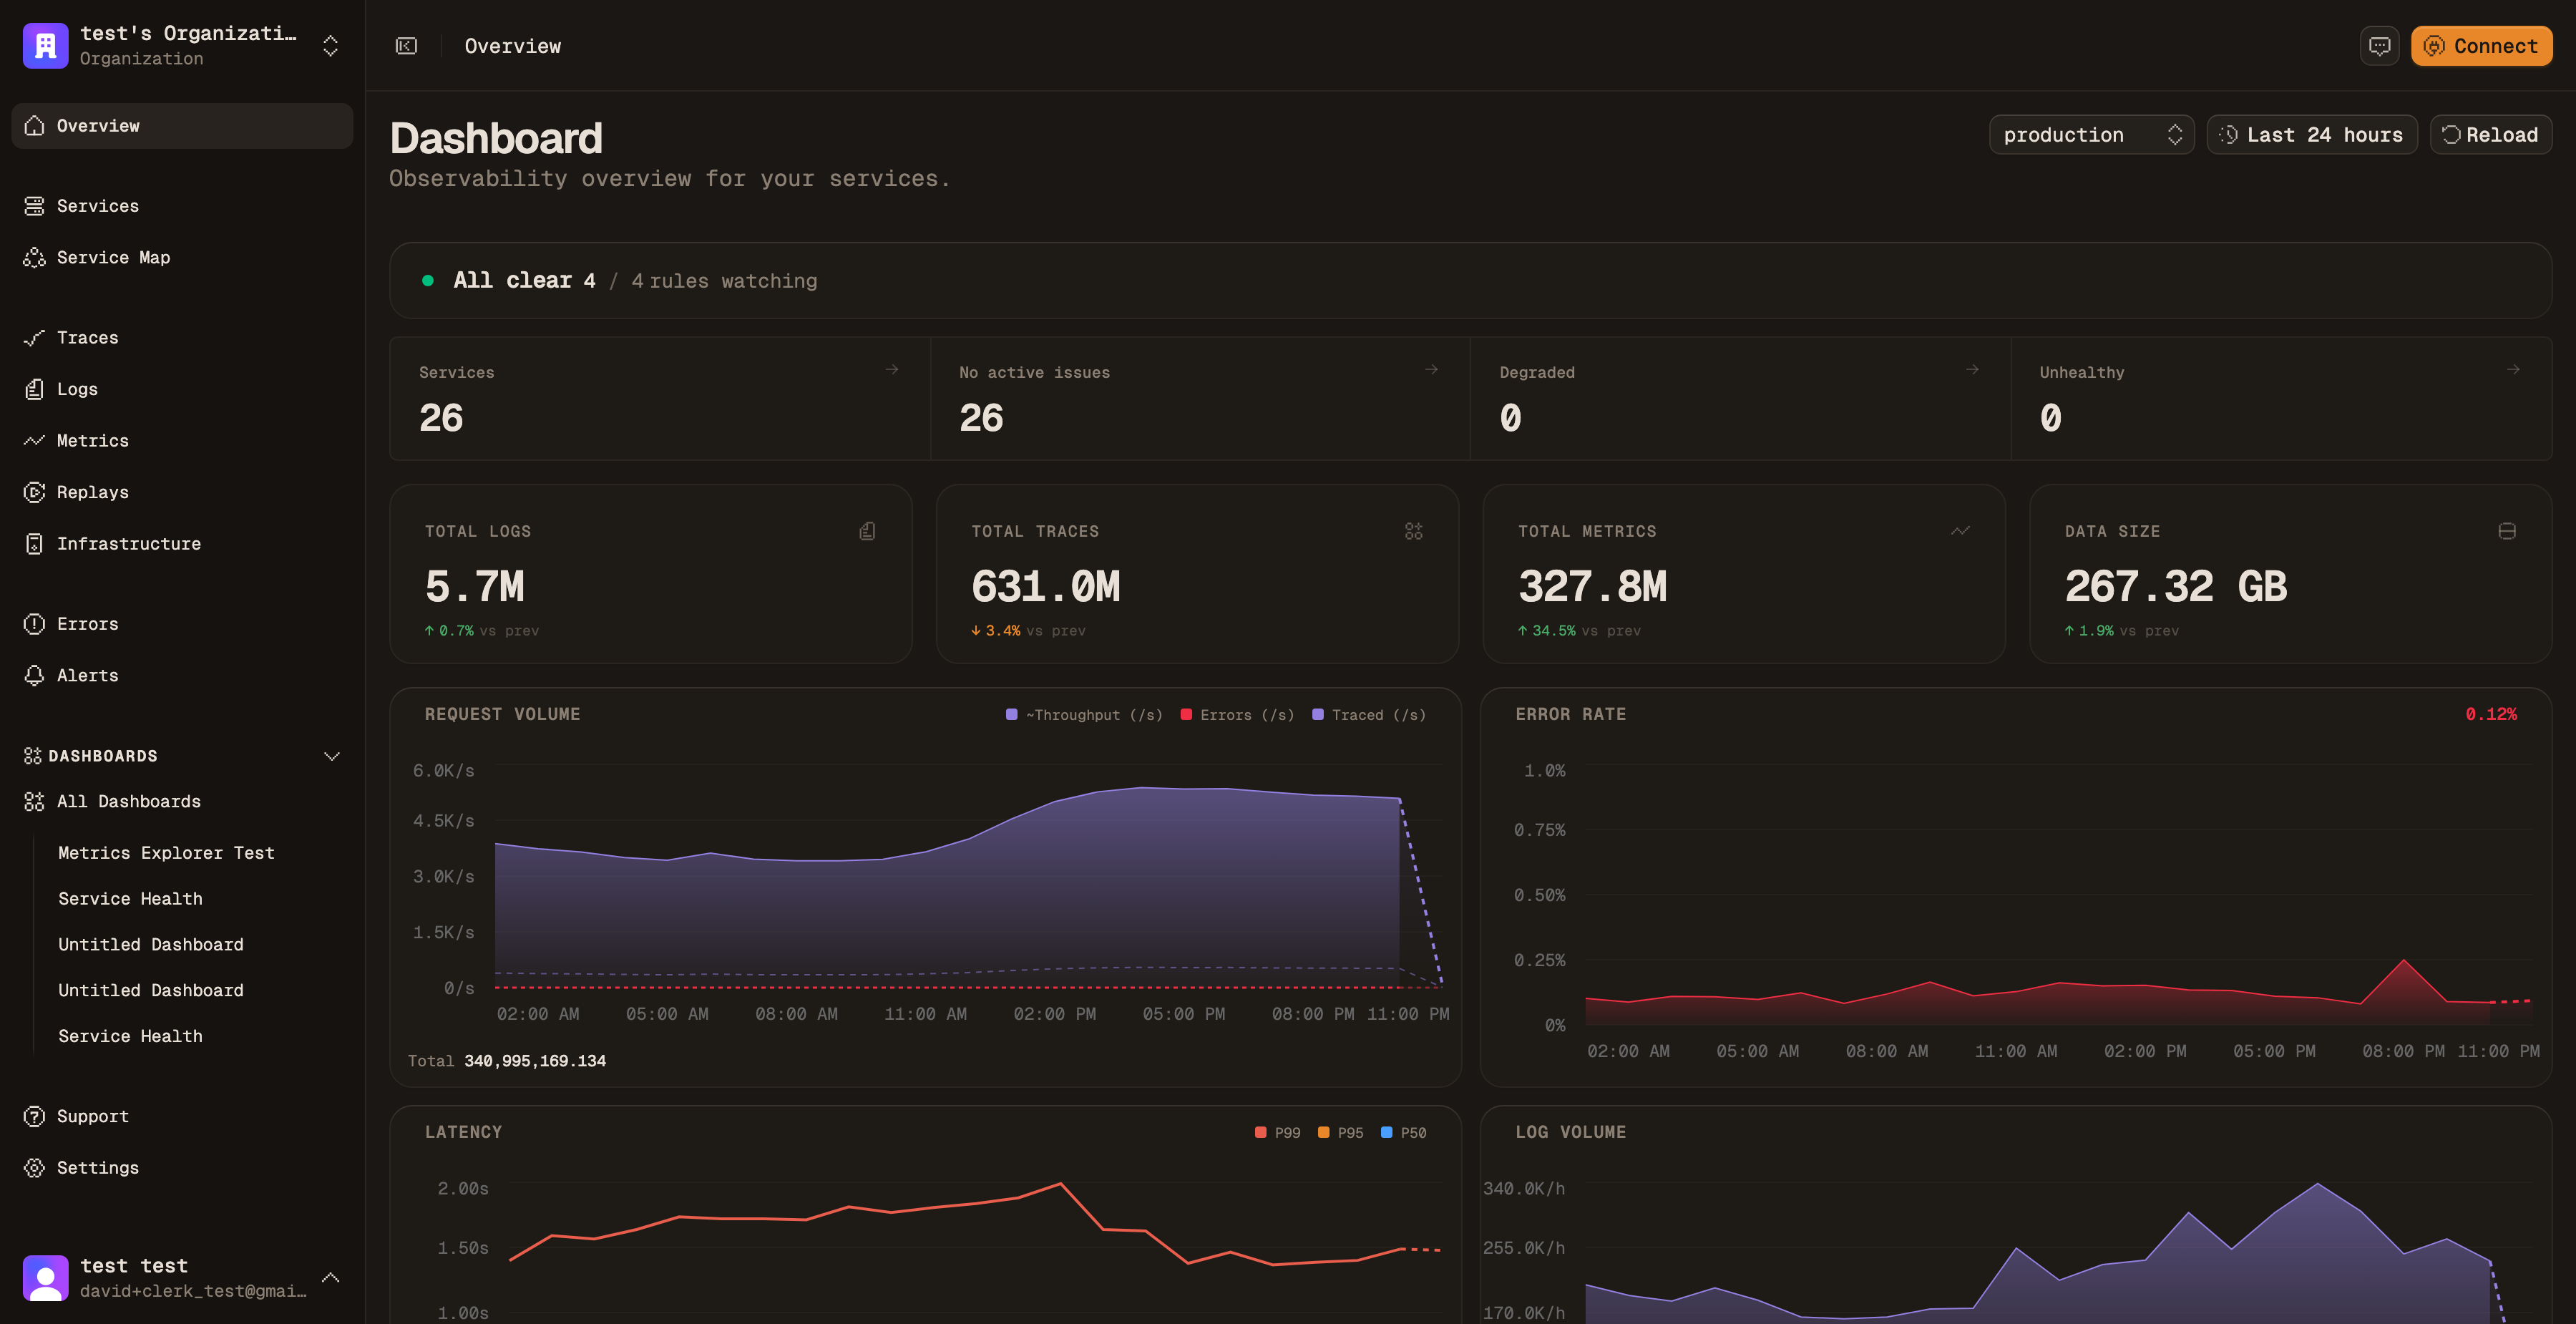
Health, latency and errors across your system.

Signals

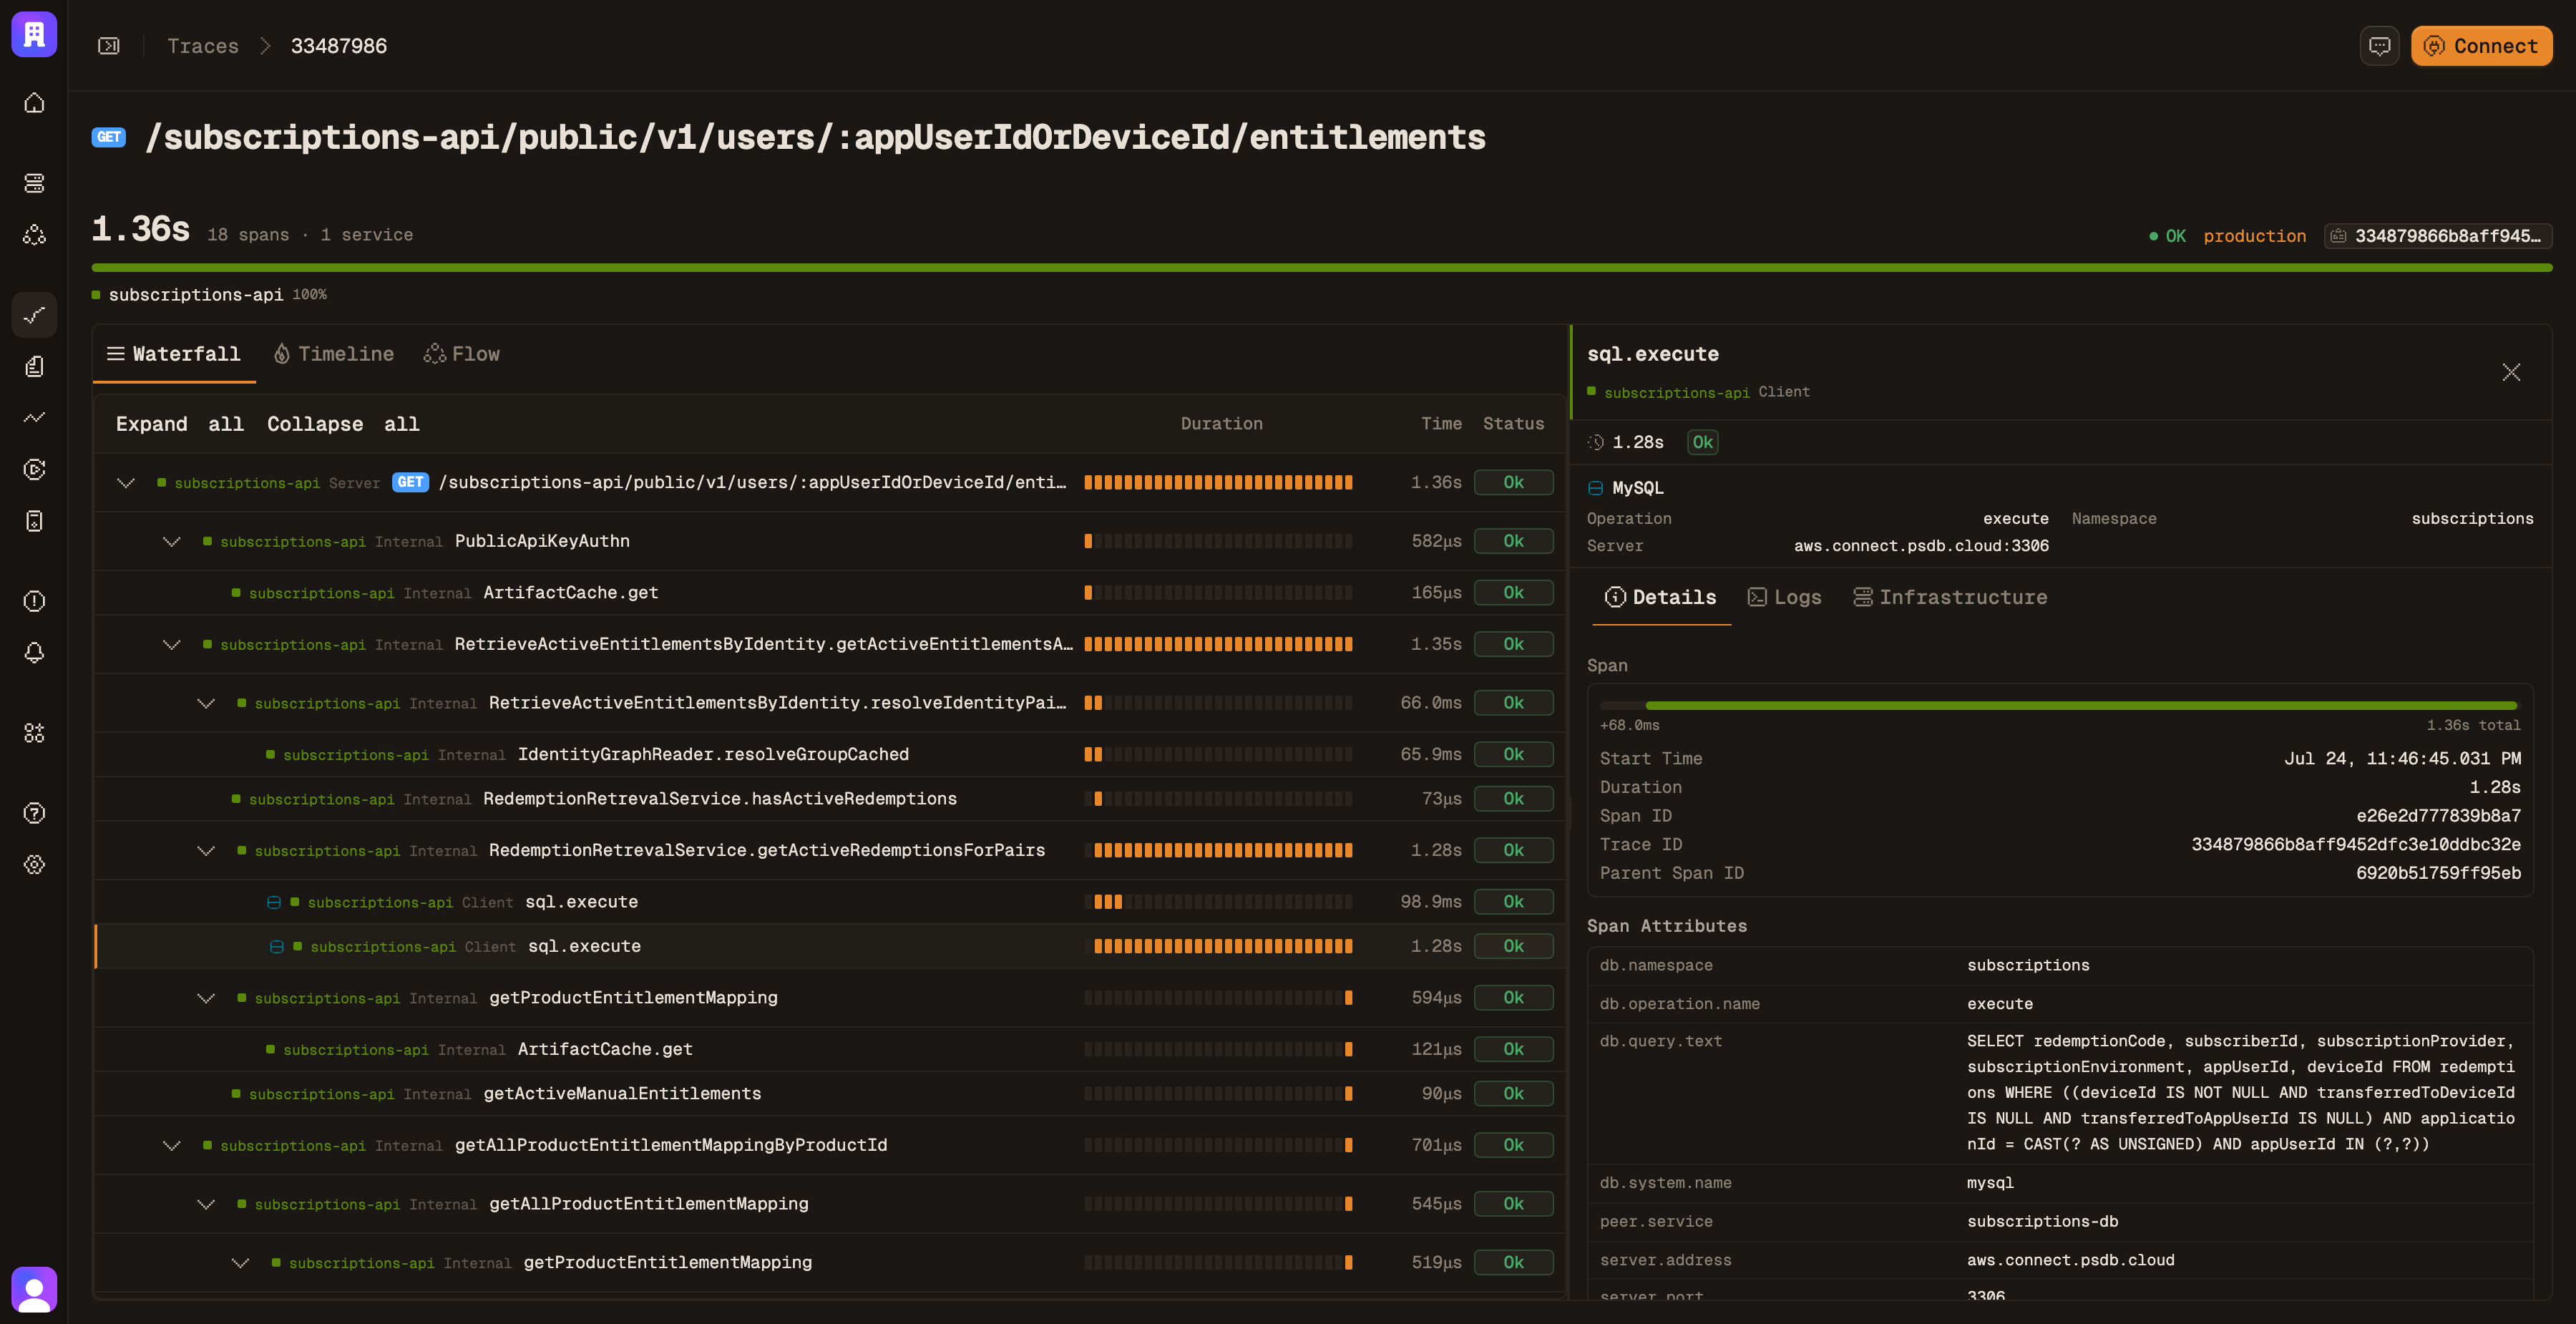
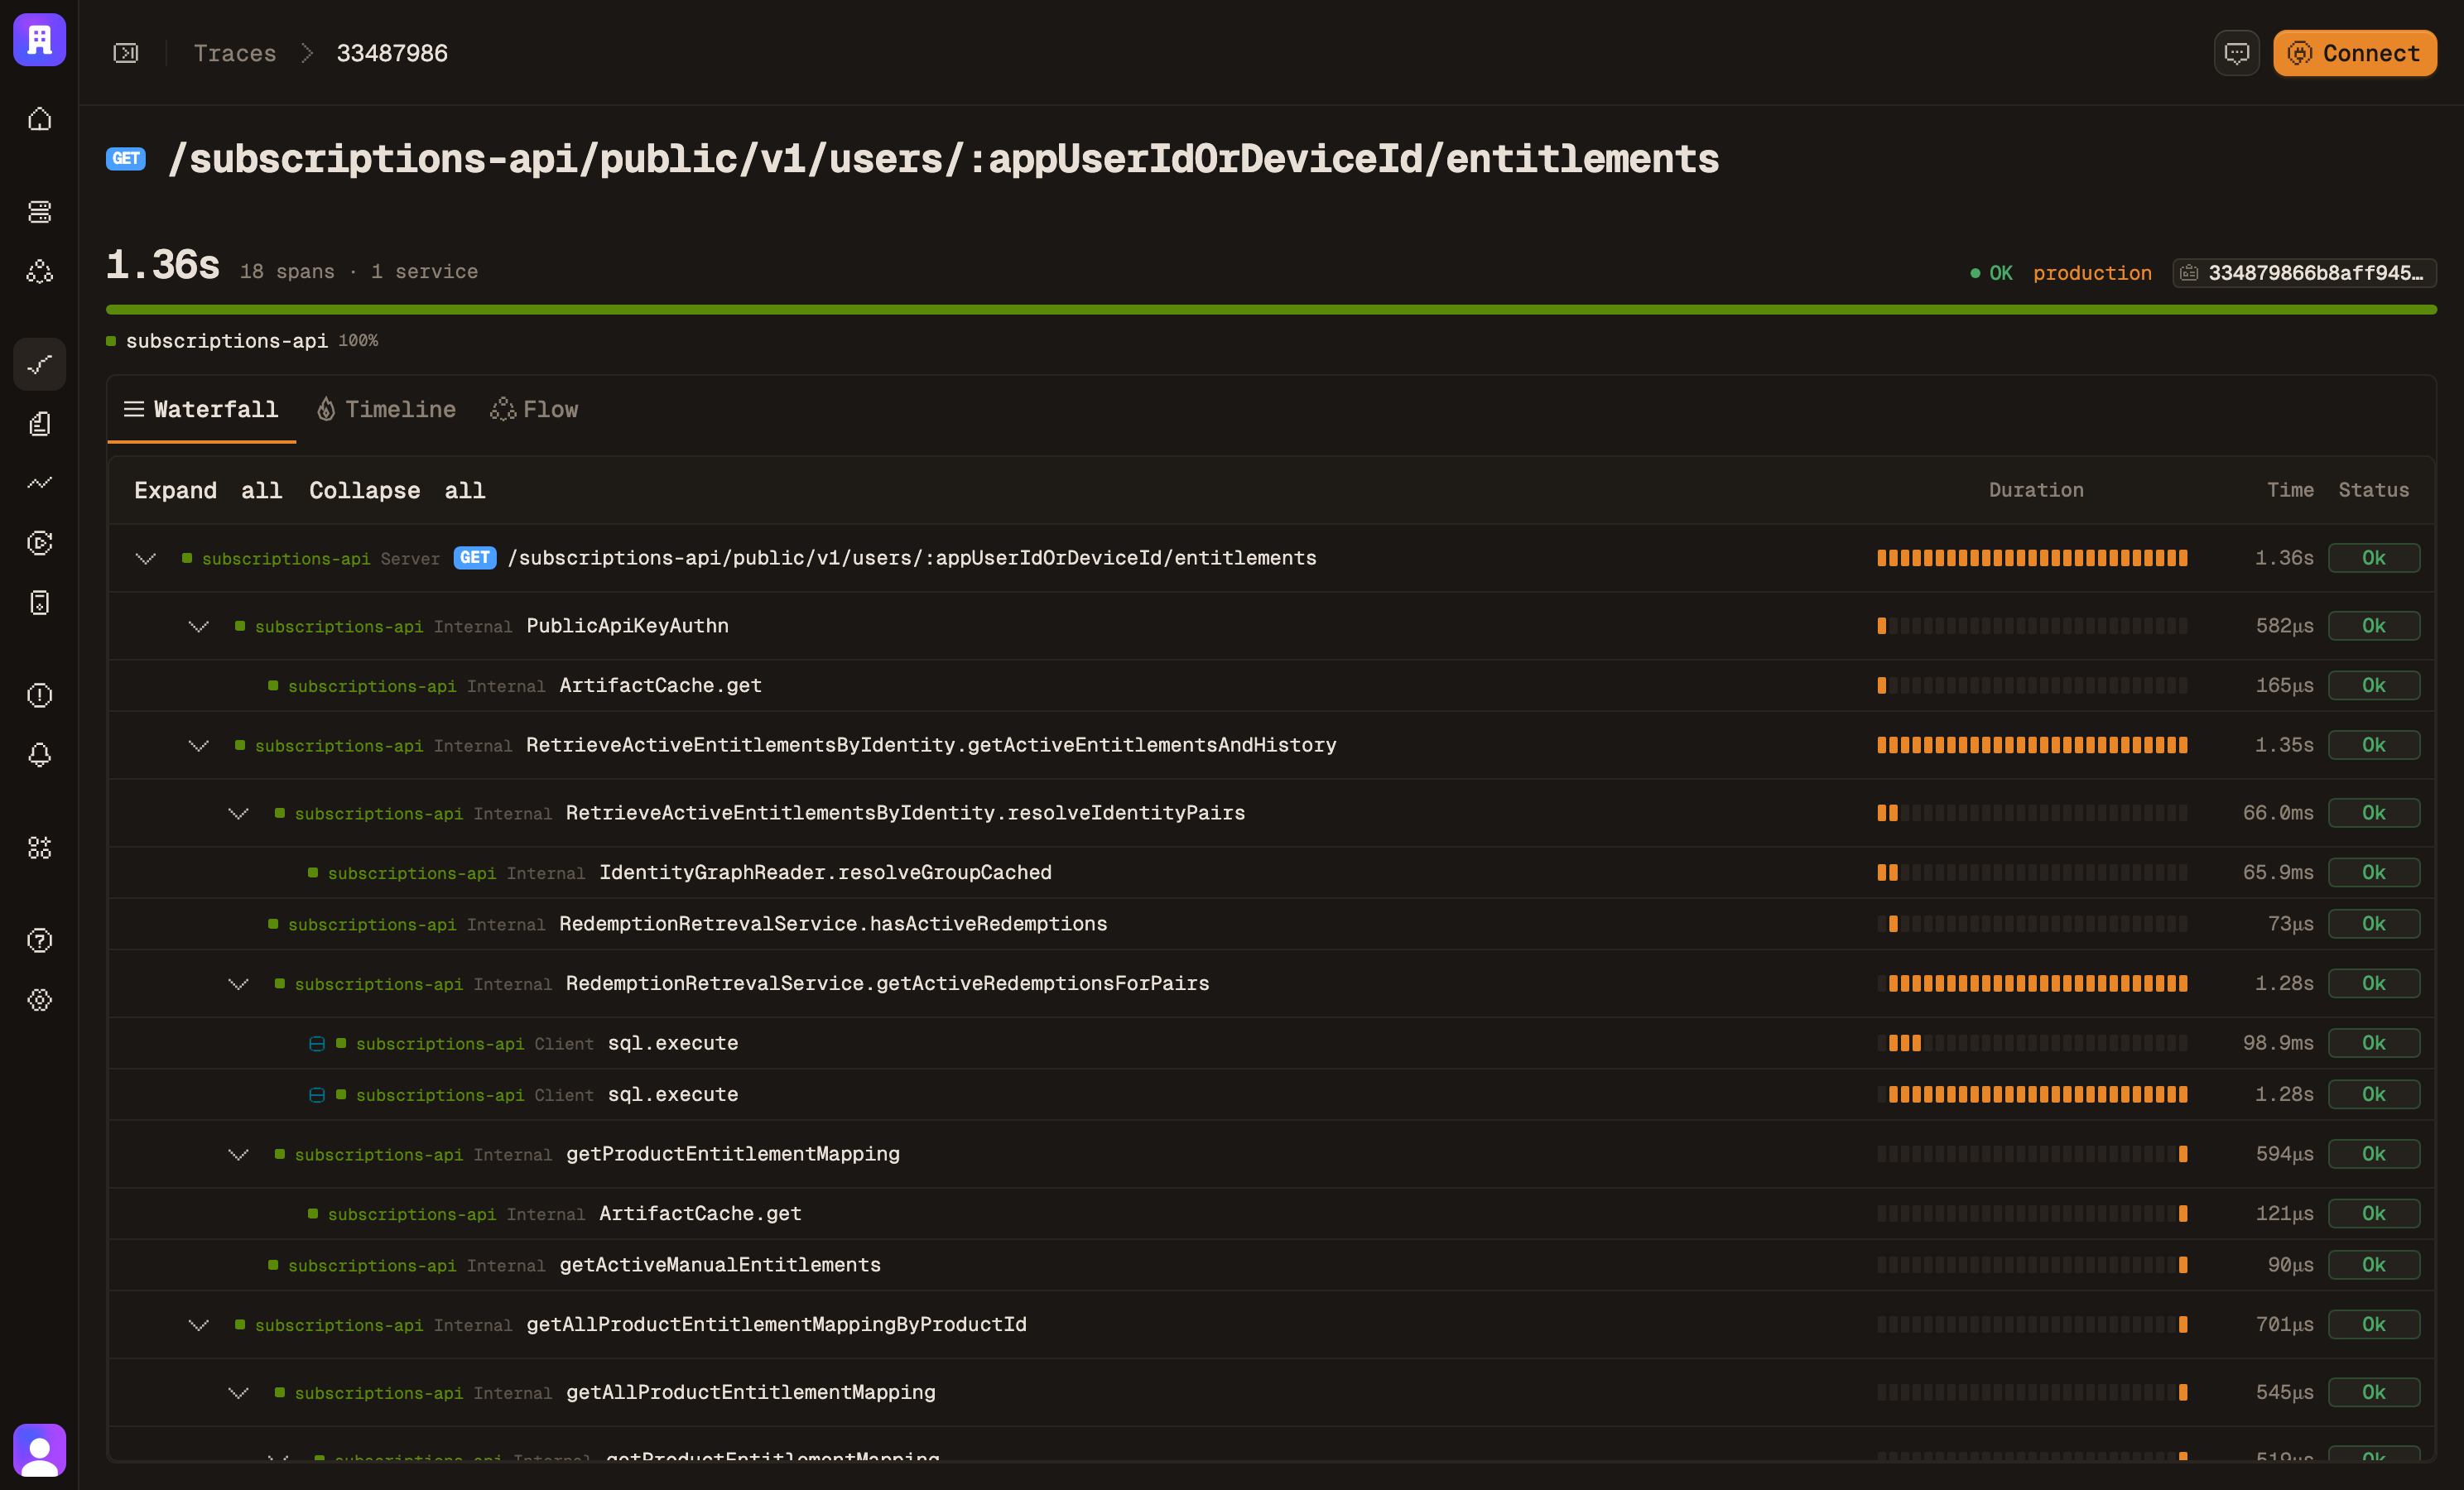
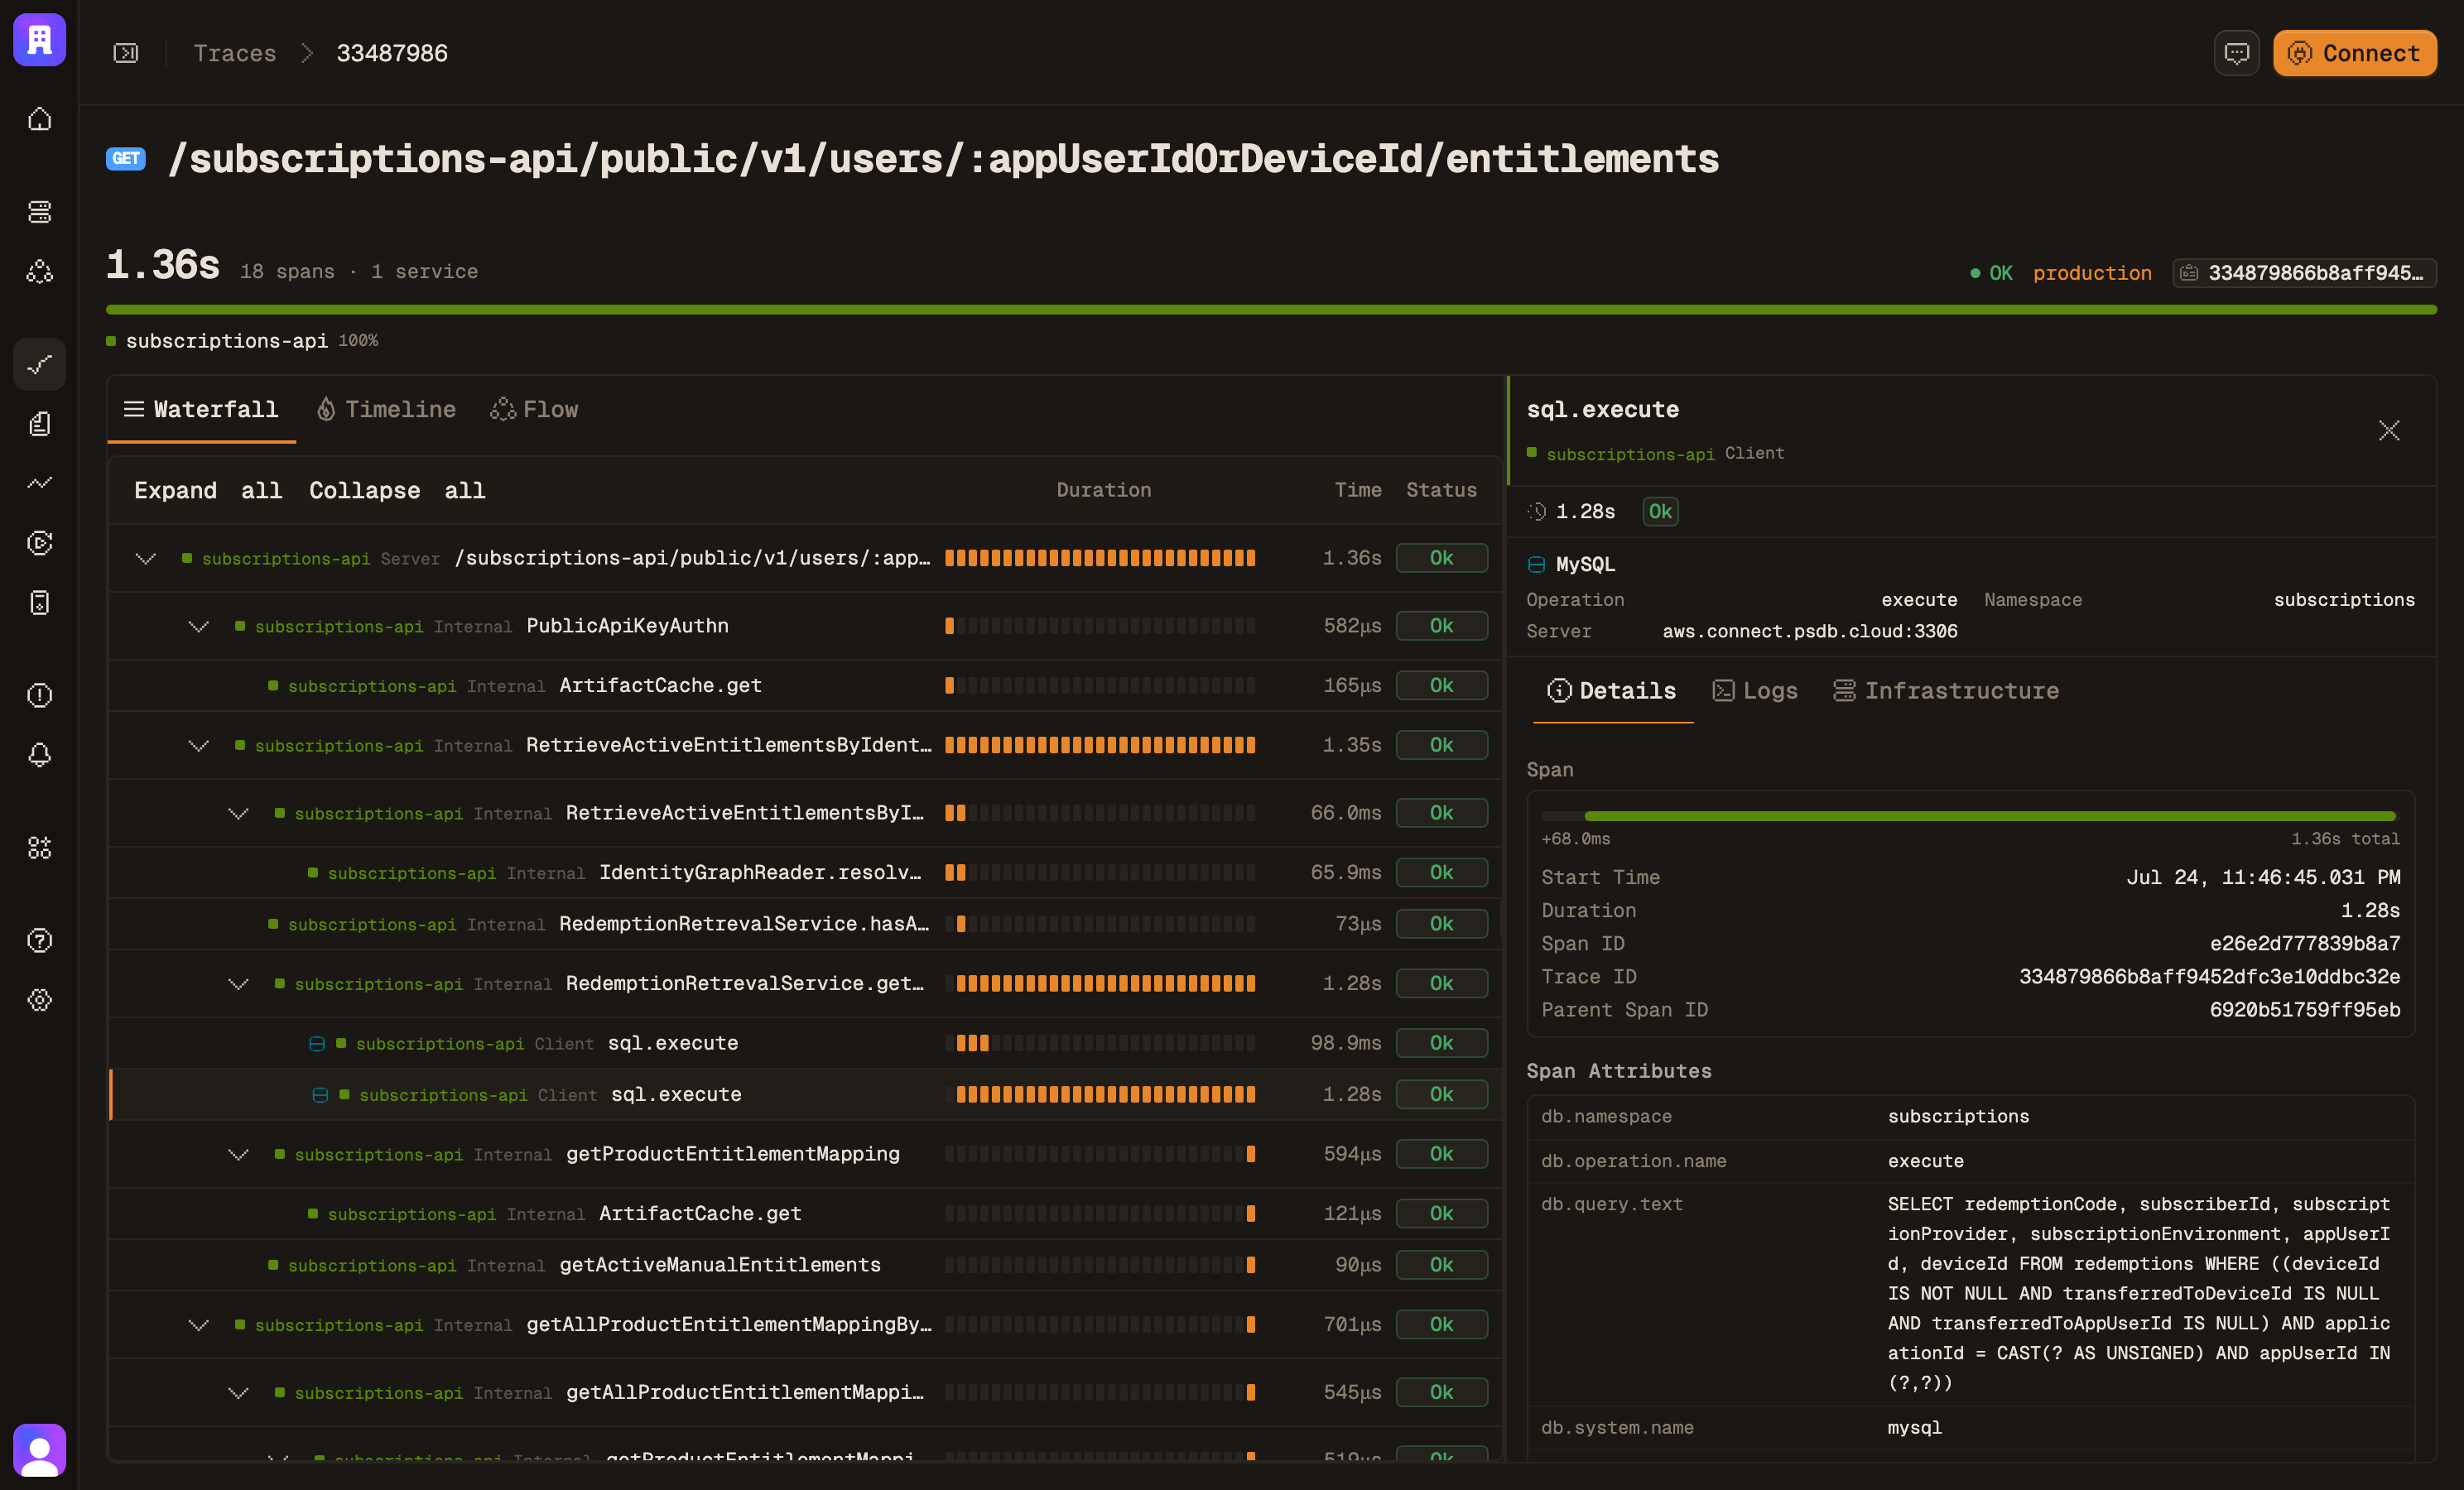
Read the trace.

Every request as a span tree, attributes intact. Click a span and see what it carried.

An 18-span API trace waterfall with nested application and SQL operations

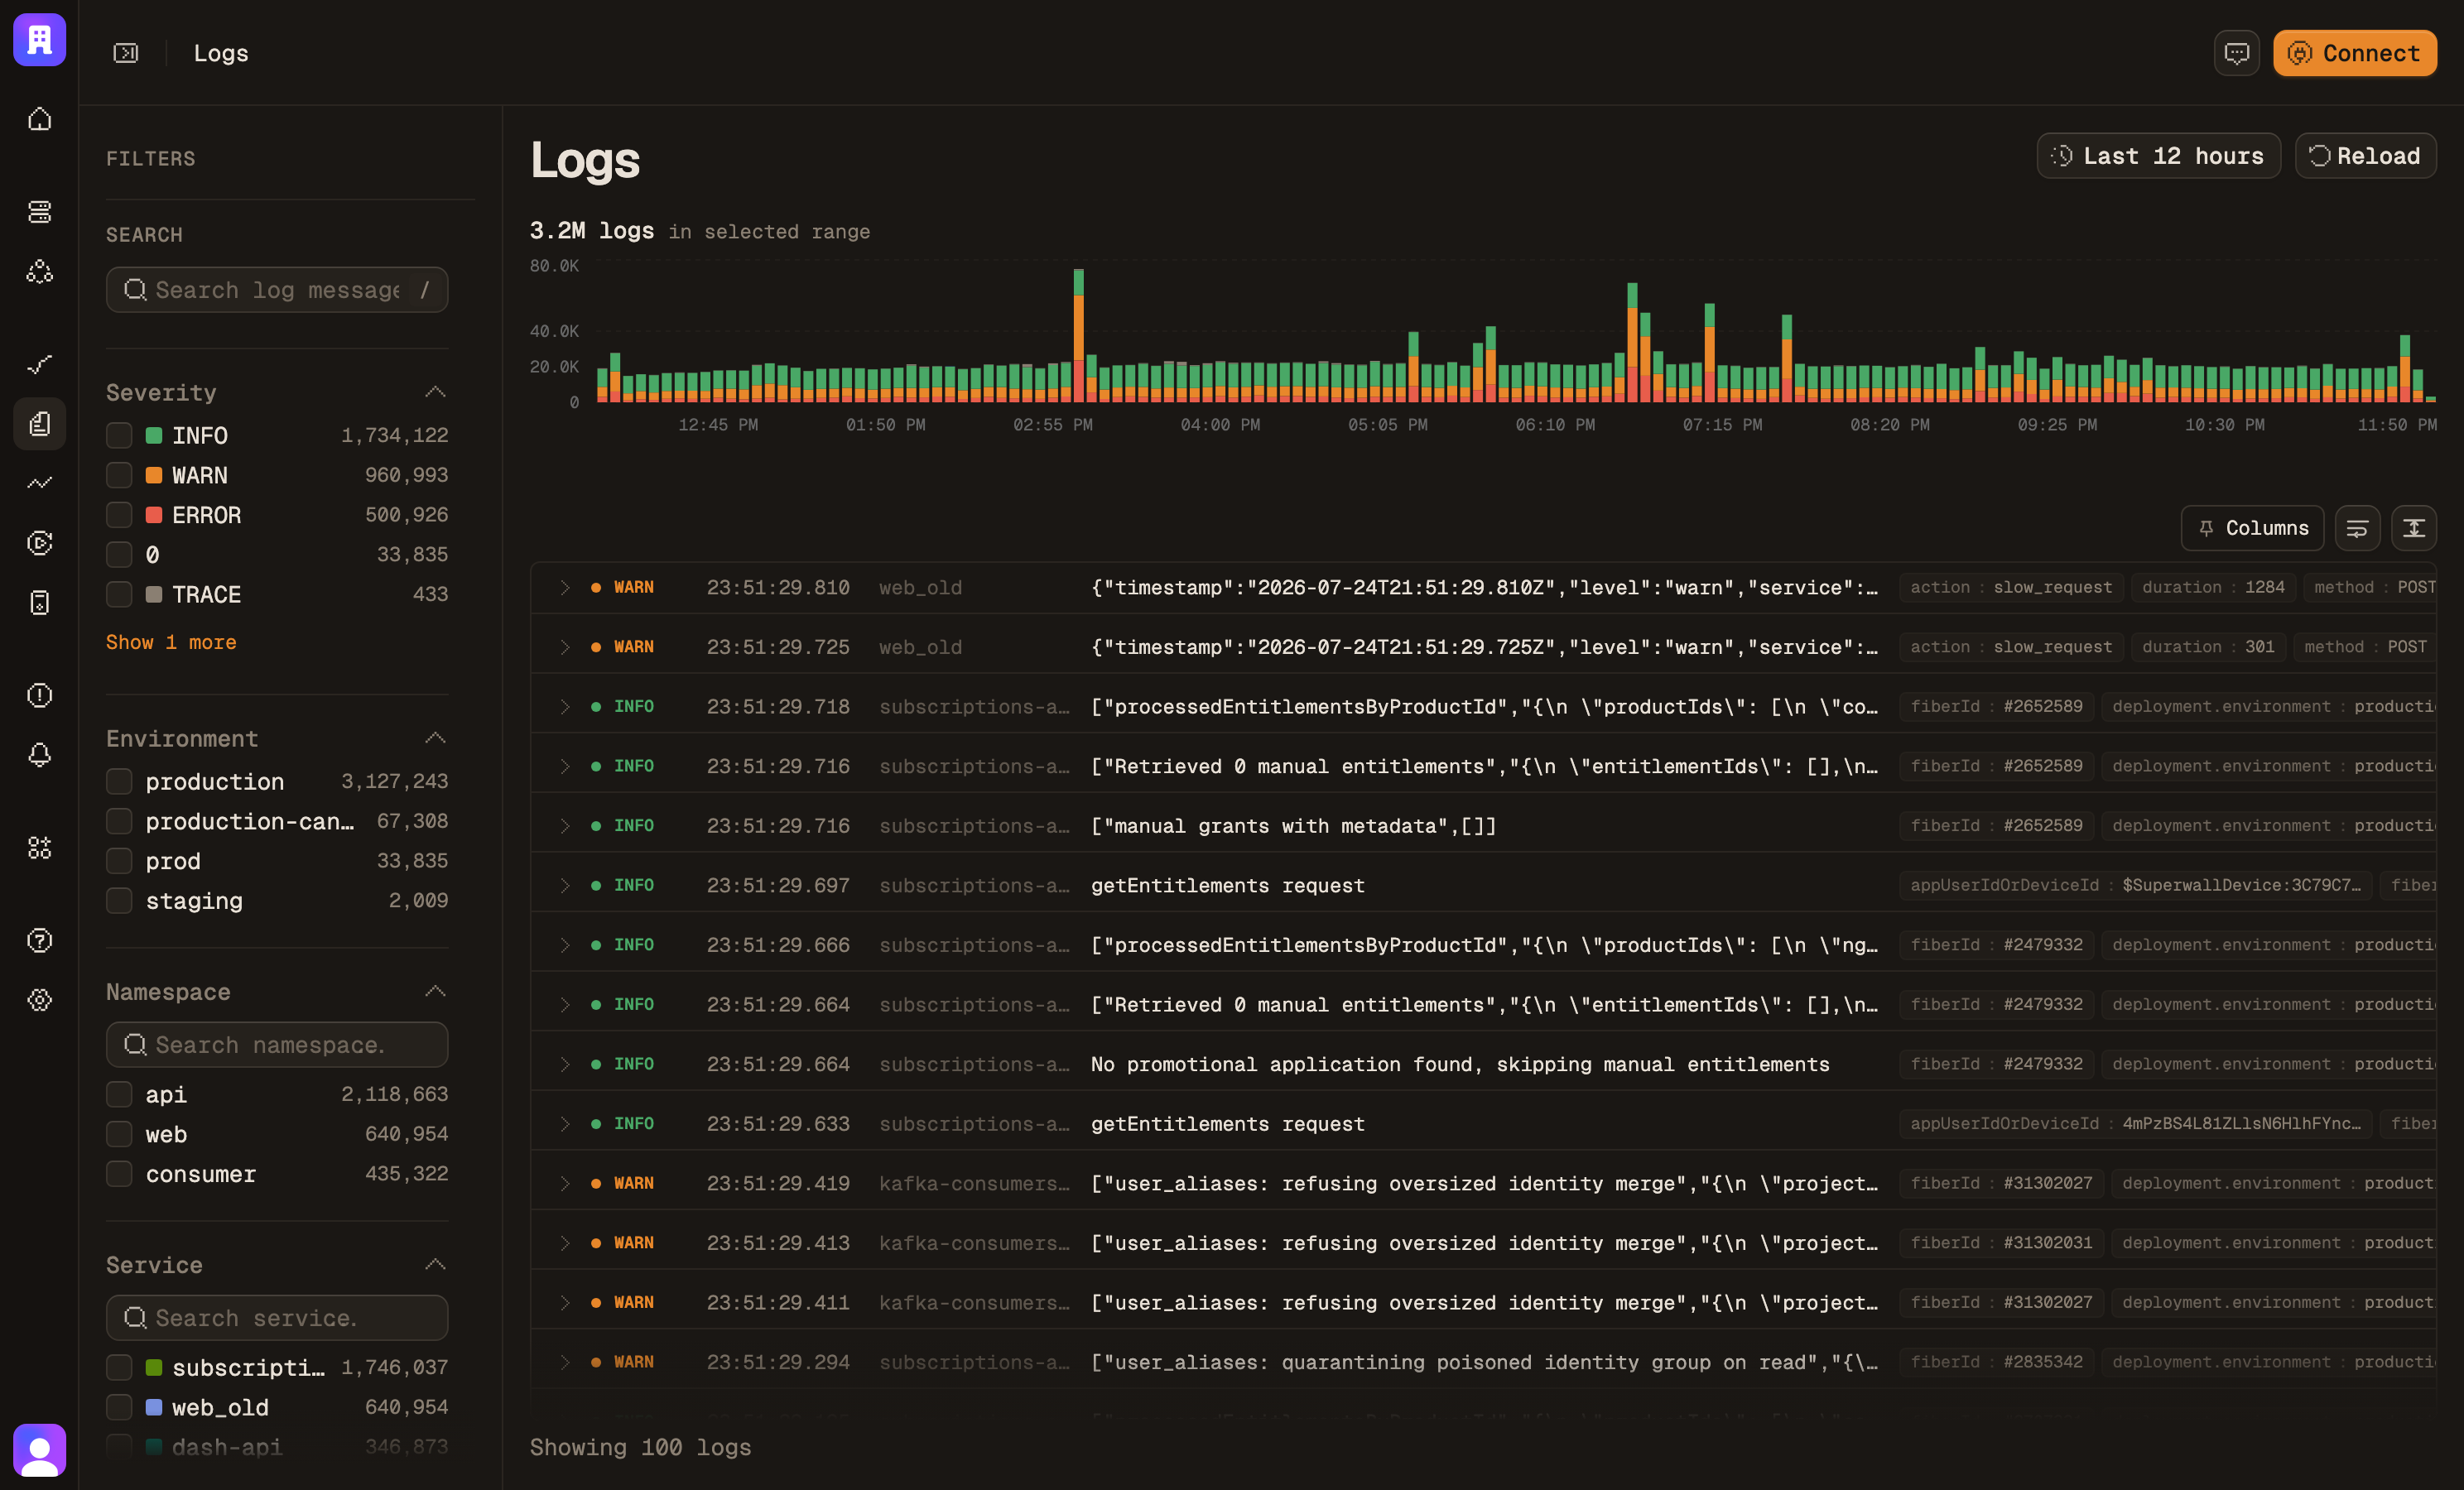
Search the logs.

Structured logs straight from OTLP. Filter by severity, service or any attribute, then jump to the trace.

Structured log search with severity facets and attribute filters

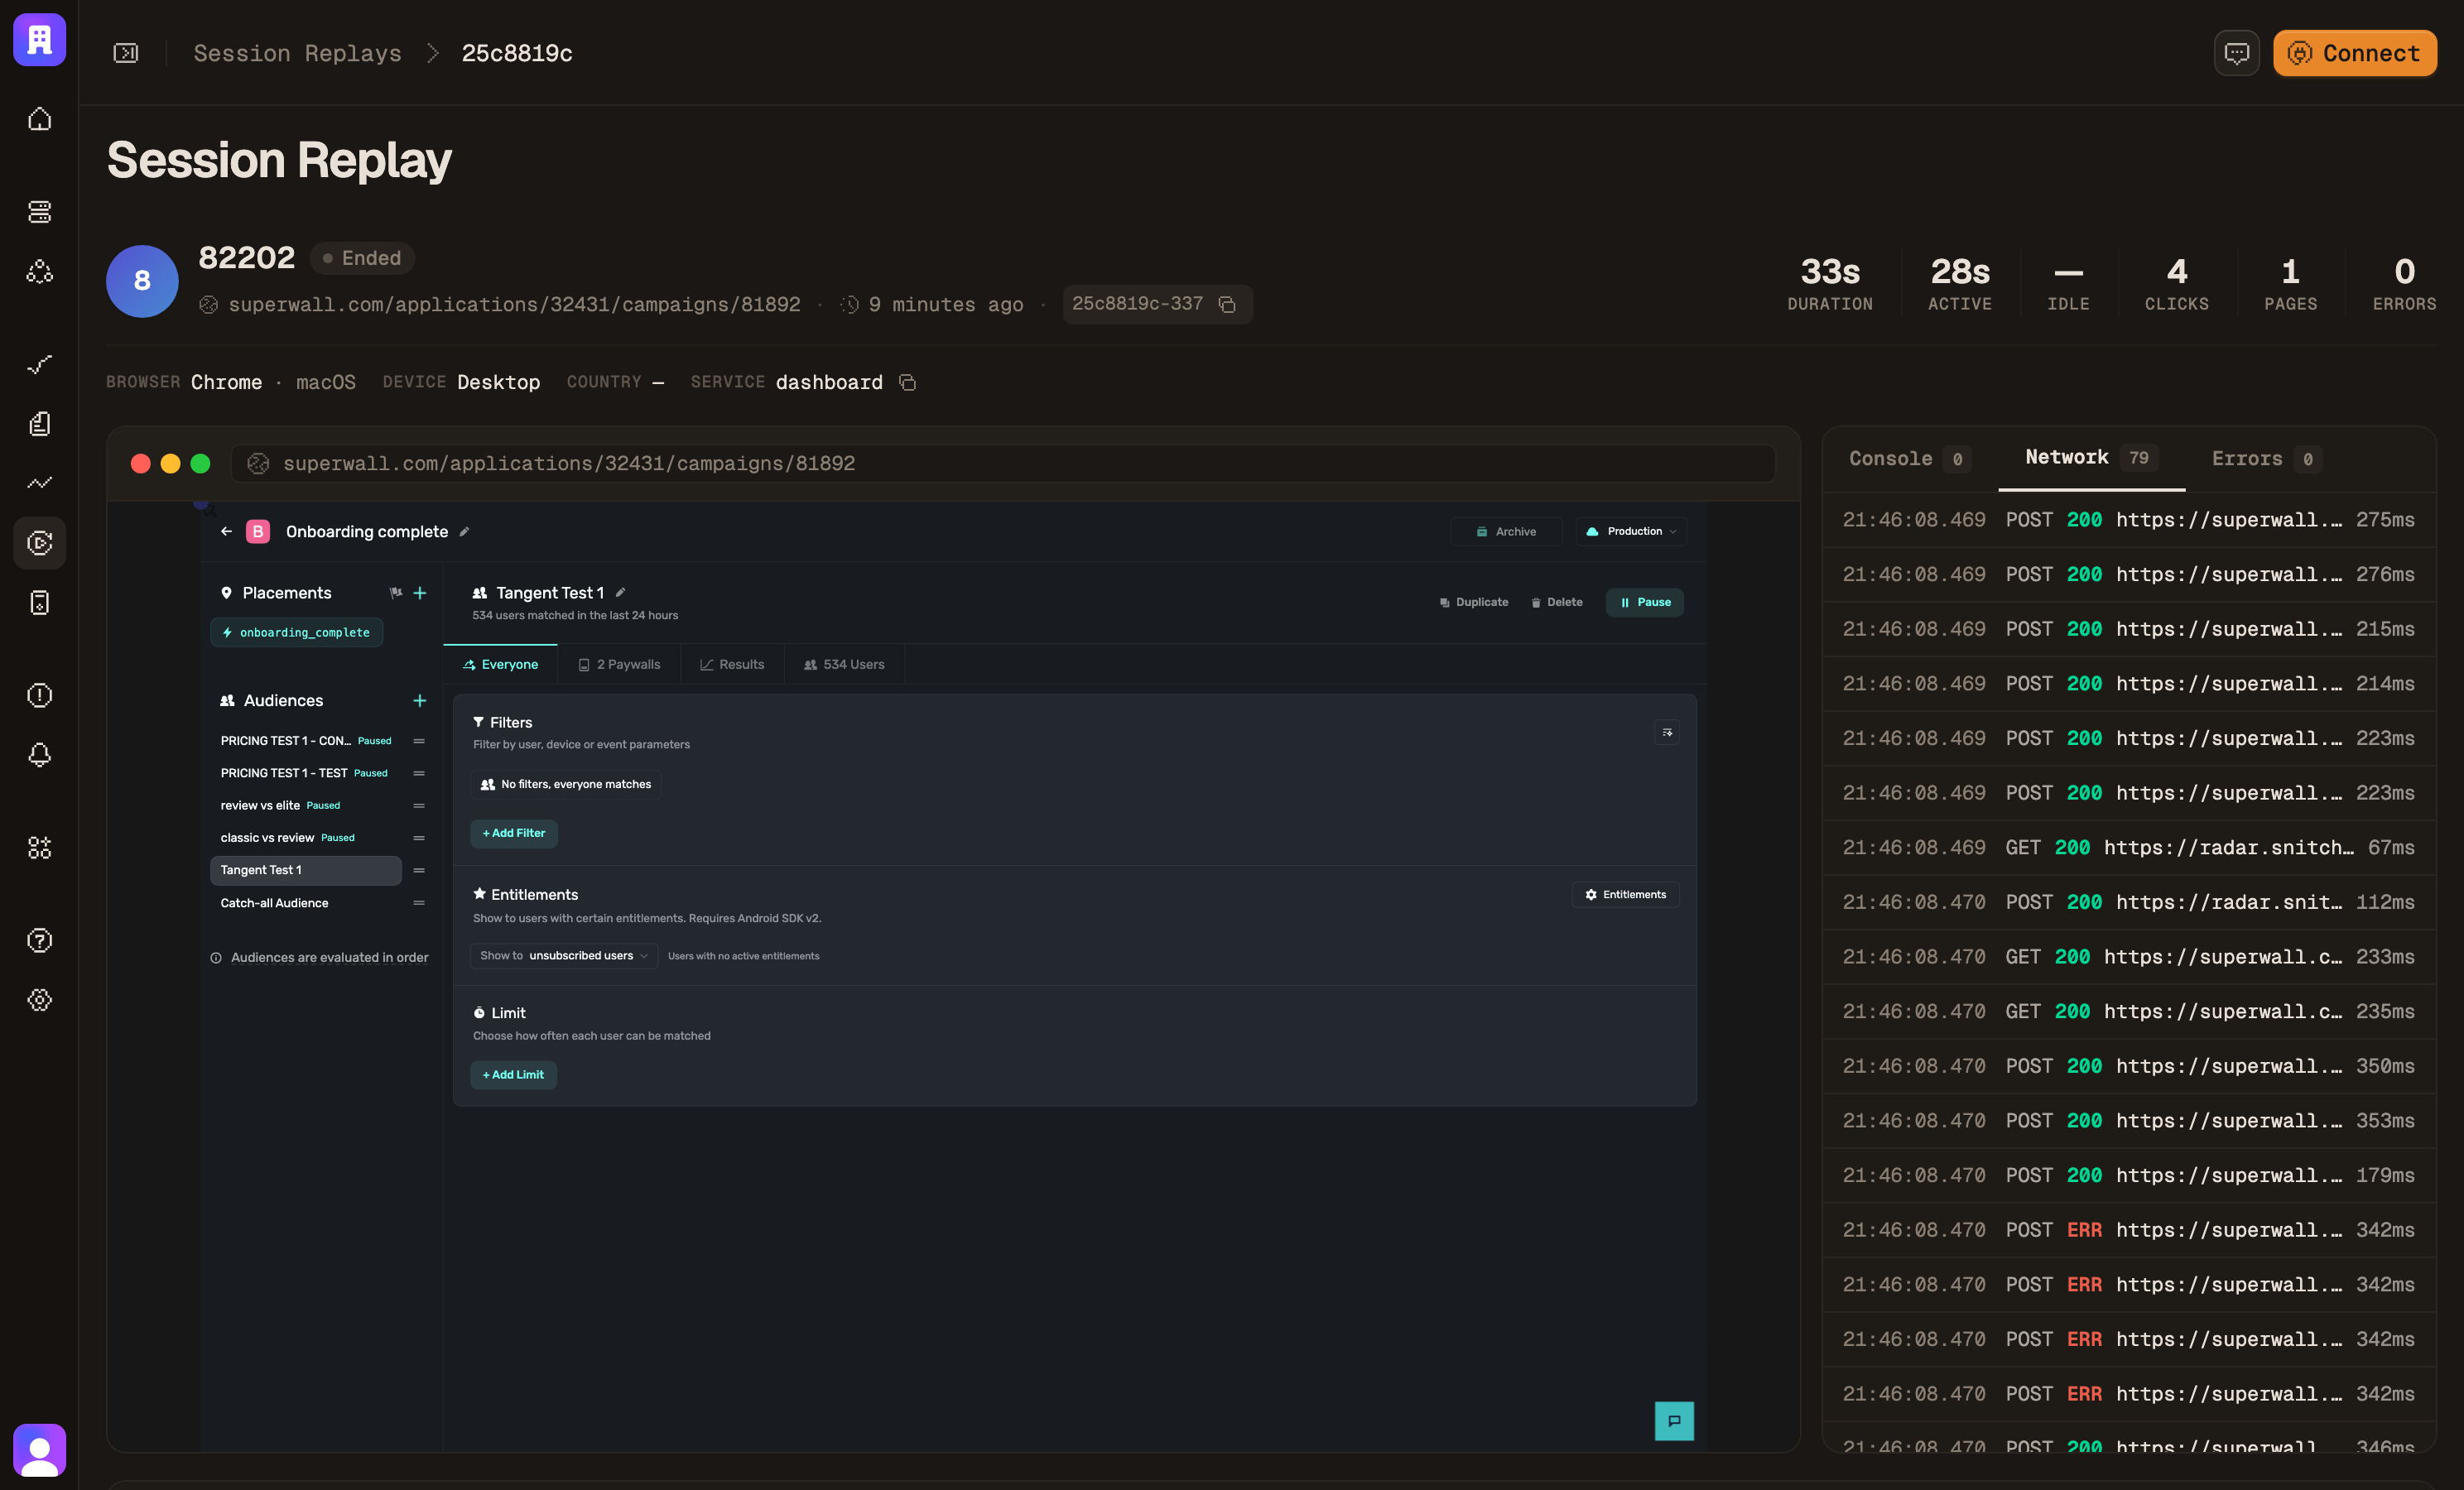
Replay the session.

Every click, route, console line and failed request. Replay and spans share one session id.

A browser session replay showing the recorded page and captured network requests

Incident

From a 3 AM page to the line that caused it.

Four surfaces, one trace id. Every step below opens from the one before it.

  1. alert trace 4f9ac21e…8b7d40f2

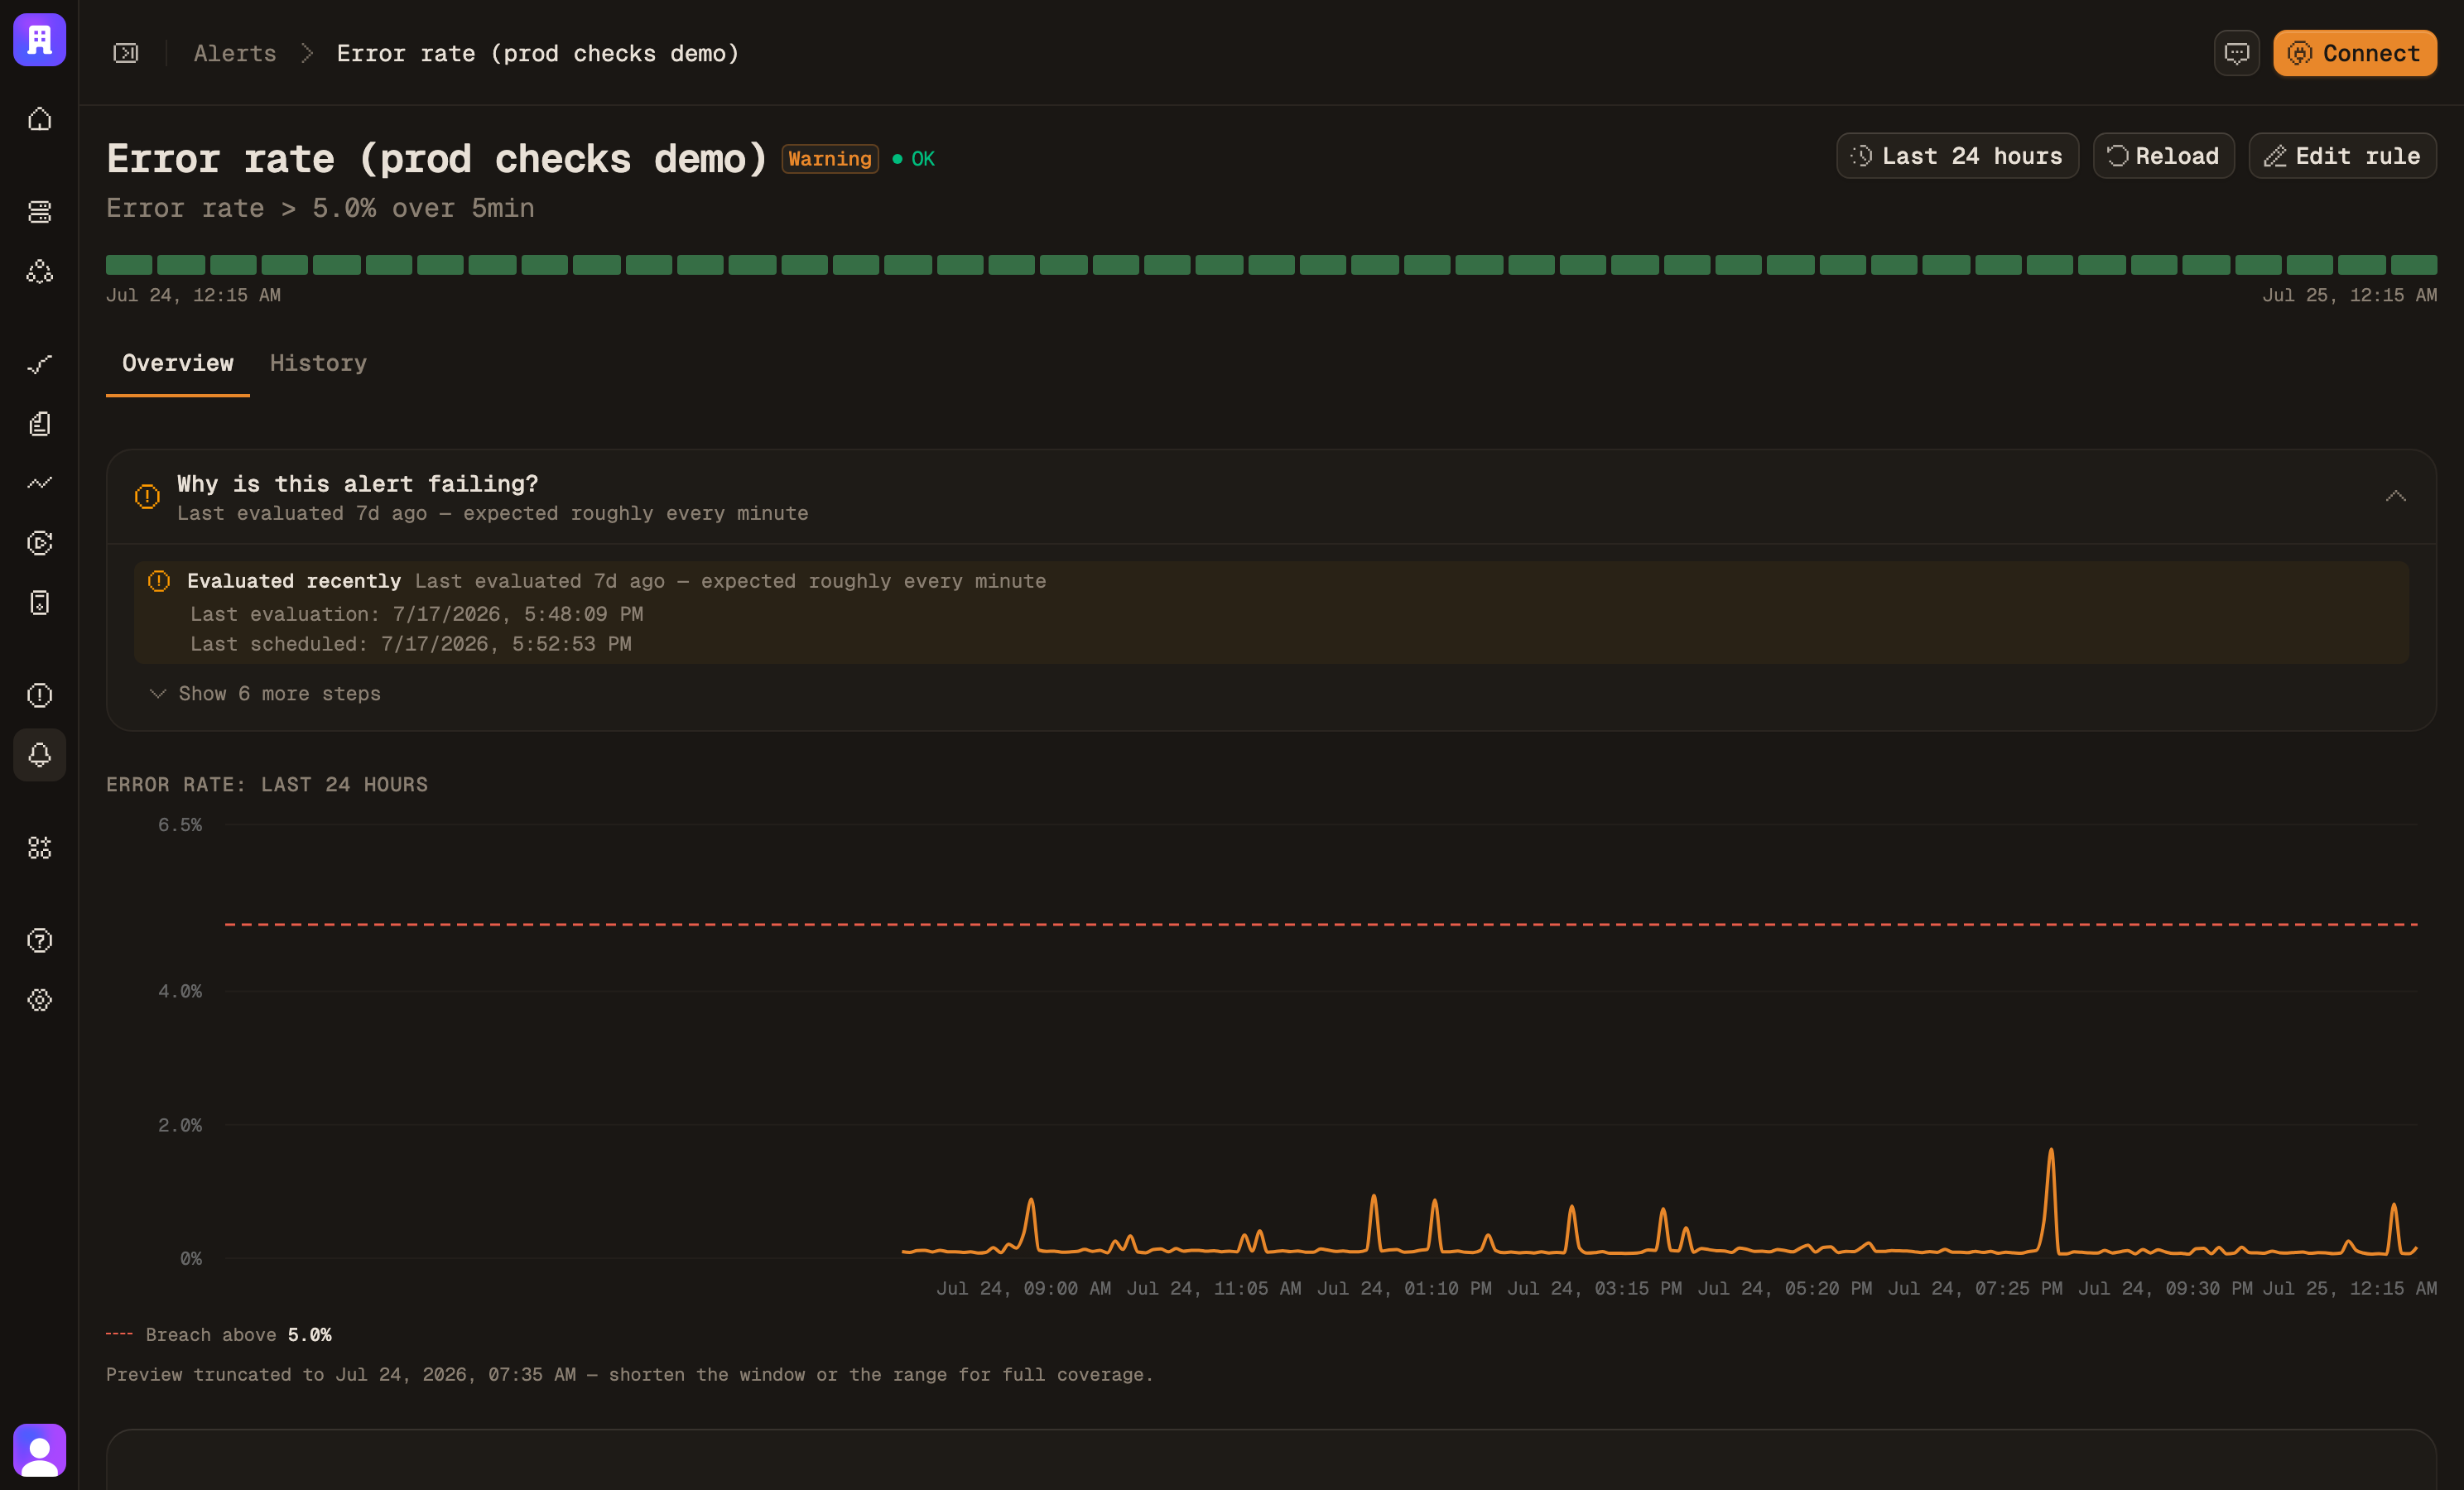
    The alert arrives with context.

    Error rate on api-gateway crosses 5%. The alert carries the service, the threshold it broke and the spans that failed. It reaches you in Slack, PagerDuty, email or a webhook.

    An alert rule with its threshold, evaluation window and firing history
  2. trace trace 4f9ac21e…8b7d40f2

    The trace opens on the failing span.

    The failing request opens as a span tree. Three Stripe retries sit at the bottom, red, each timing out at exactly 1.75 seconds.

    A span selected in the waterfall with its full attribute set open alongside
  3. logs trace 4f9ac21e…8b7d40f2

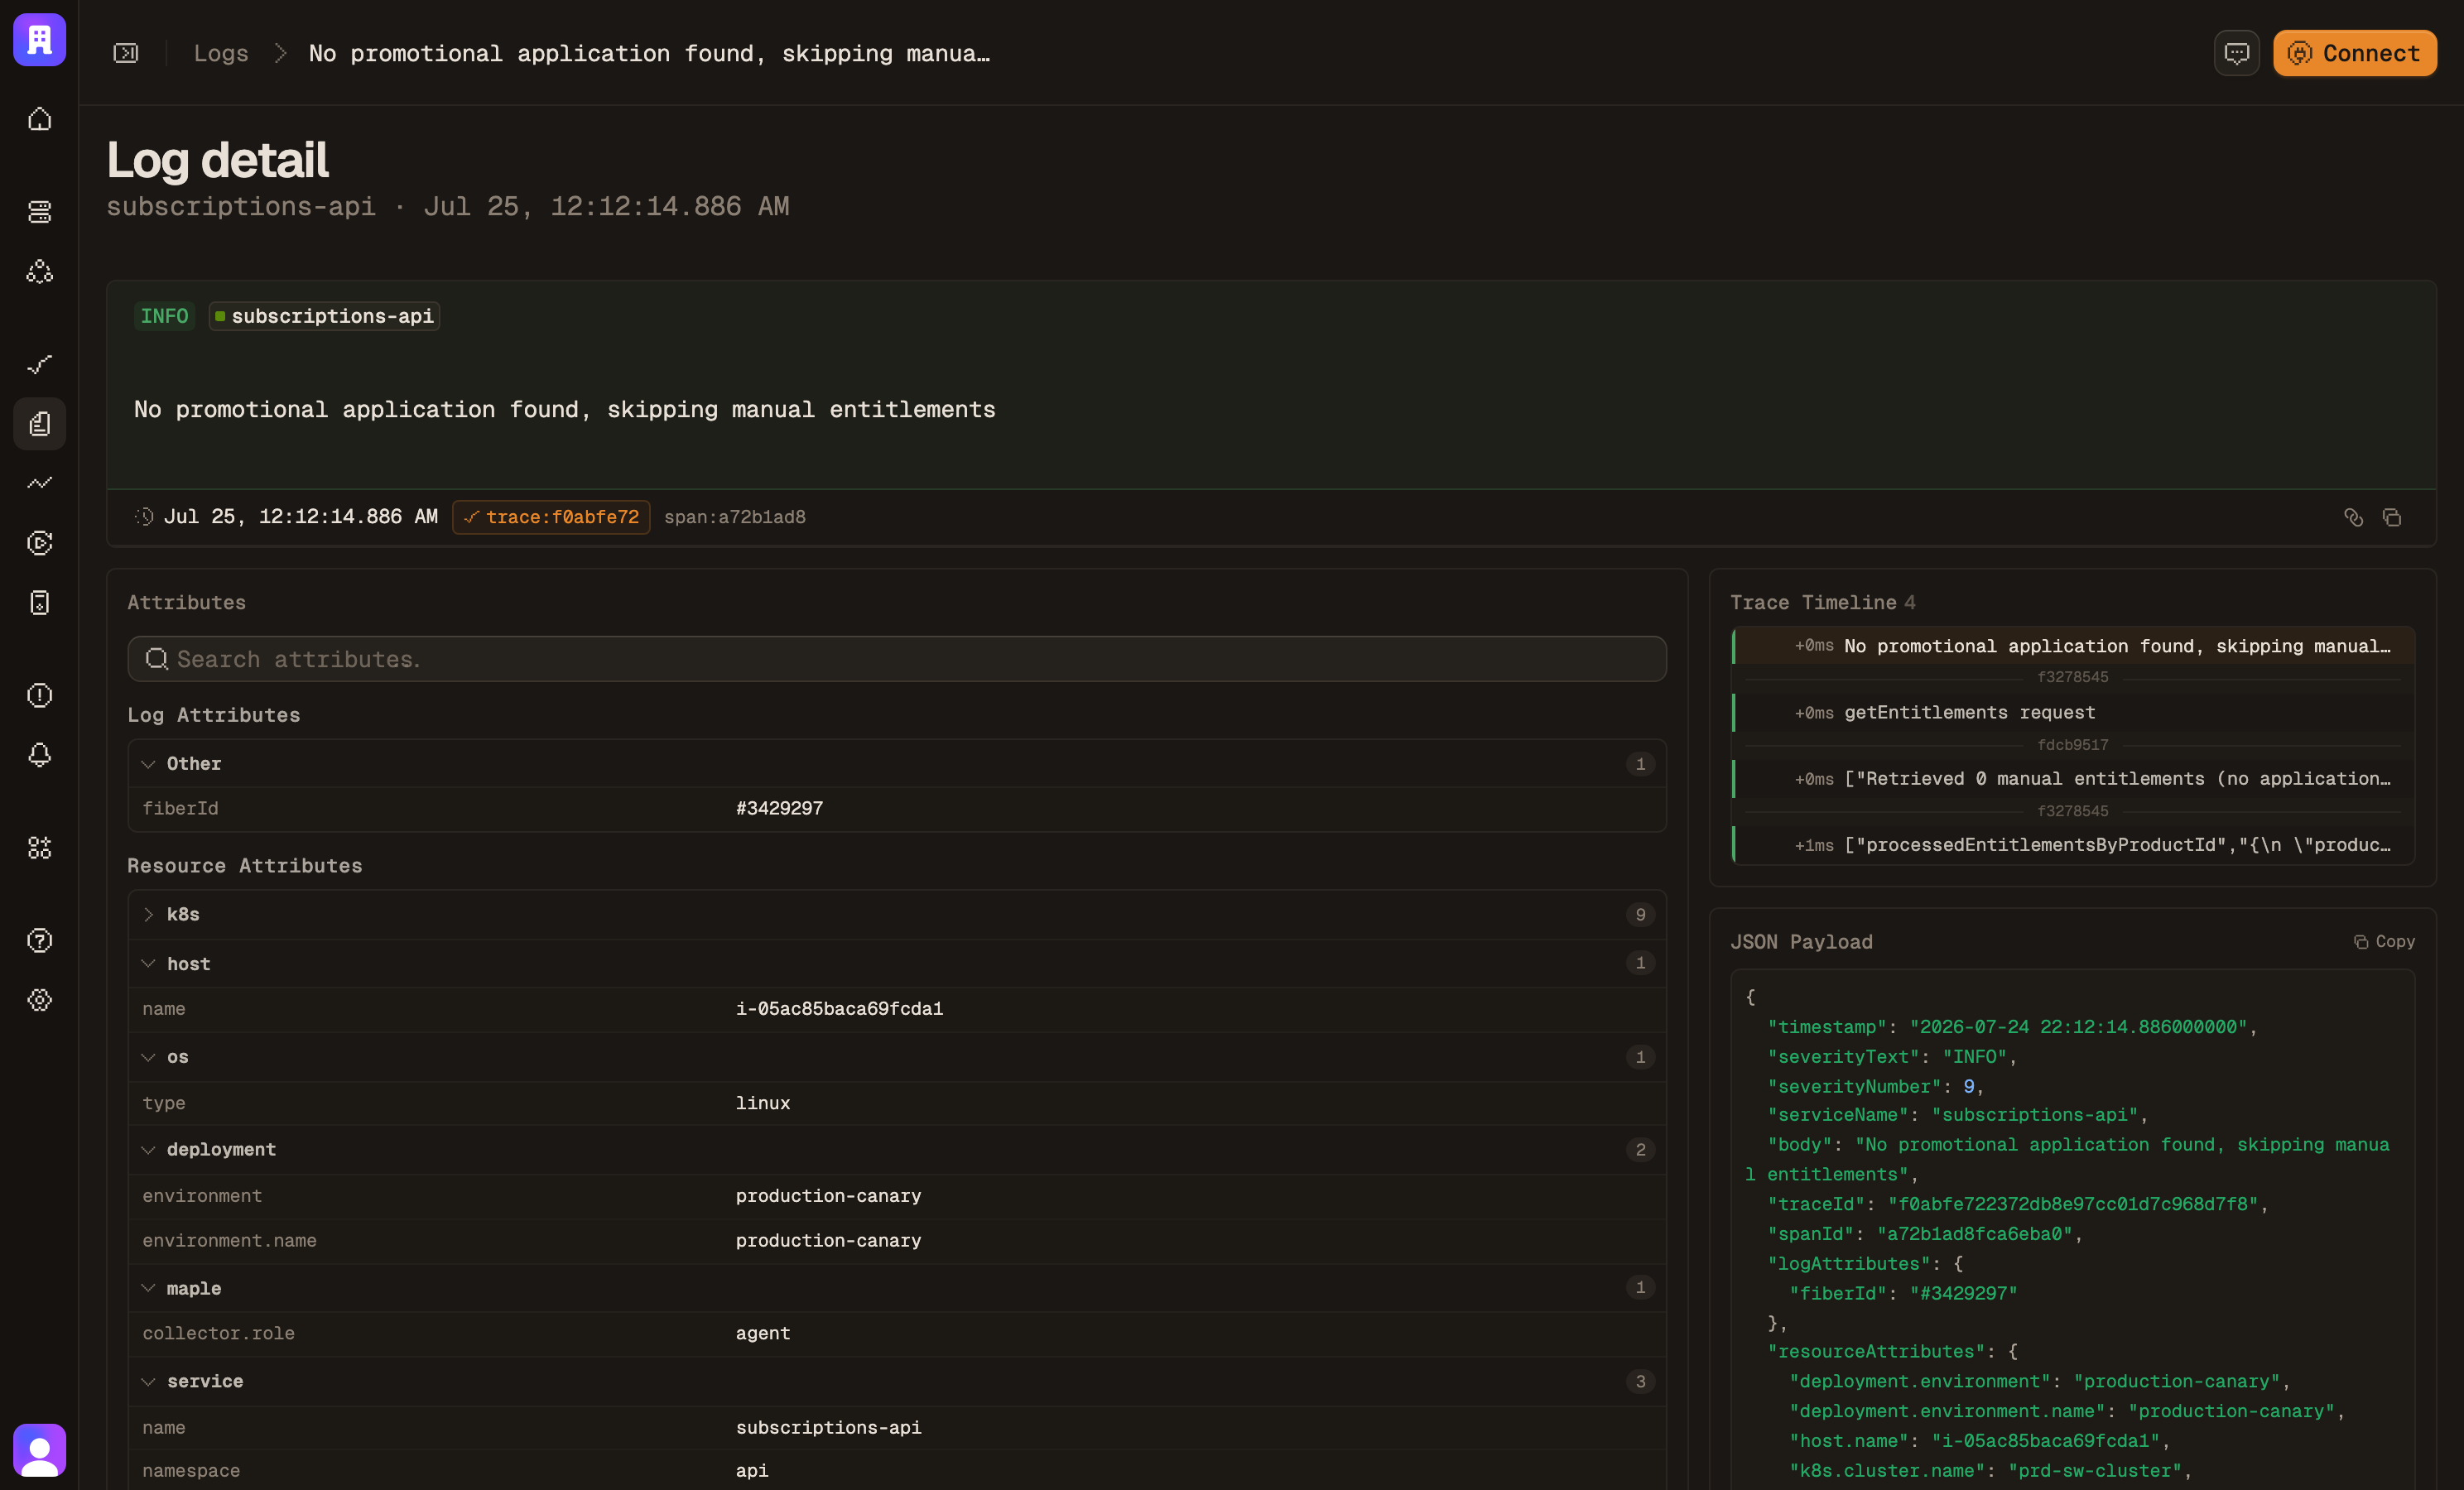
    The logs are already correlated.

    Jump from the failing span to its logs on the trace id. Retry exhaustion, connection pool at 20/20. The confirmation is on the same screen.

    A log detail with linked trace and span IDs, correlated events and full resource attributes
  4. agent trace 4f9ac21e…8b7d40f2

    Or hand it to an agent.

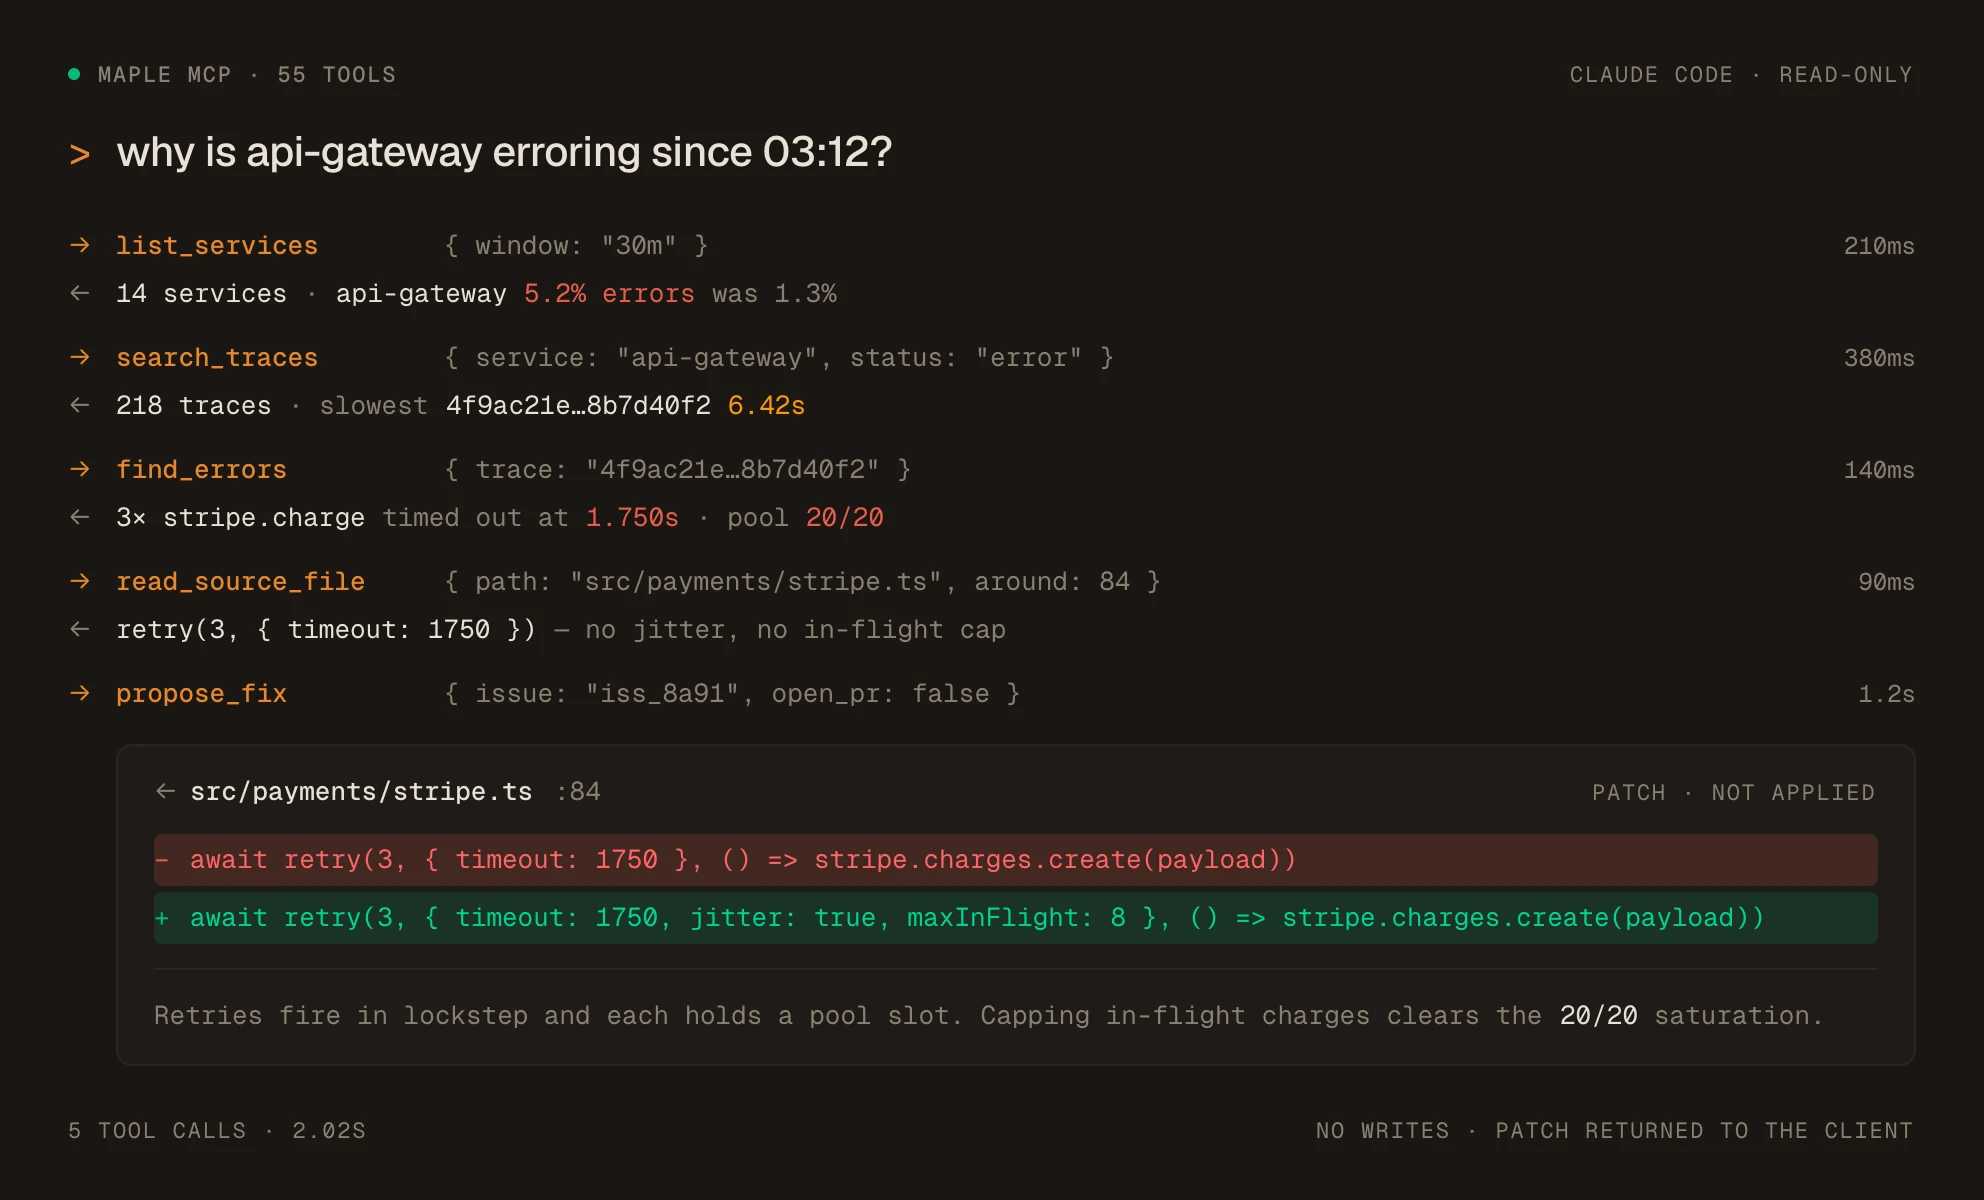
    Point Claude, Cursor or any MCP client at Maple. It lists services, searches traces, reads the source and proposes the fix.

    An MCP client walking the same incident: five tool calls from list_services to propose_fix, ending in a patch

Local

Maple on your laptop, as one binary.

One maple executable runs OTLP ingest, an embedded database, the query API and the dashboard on 127.0.0.1. No account, and your telemetry stays on your machine.

$ brew install Makisuo/tap/maple

or curl -fsSL https://maple.dev/cli/install | sh

local · 127.0.0.1:4318 DEMO
maple start
🍁 maple · local mode
listening on http://127.0.0.1:4318
OTLP/HTTP POST /v1/{traces,logs,metrics}
query POST /local/query
dashboard https://local.maple.dev
· bundled UI: pass --offline
data ~/.maple/data
pid 48213 · stop with maple stop
one binary · one port telemetry stays on 127.0.0.1

Platform

Everything else you'd have bought separately.

Metrics, service maps, error grouping, alerting and an MCP server, all on the instrumentation you already send.

Metrics & dashboards

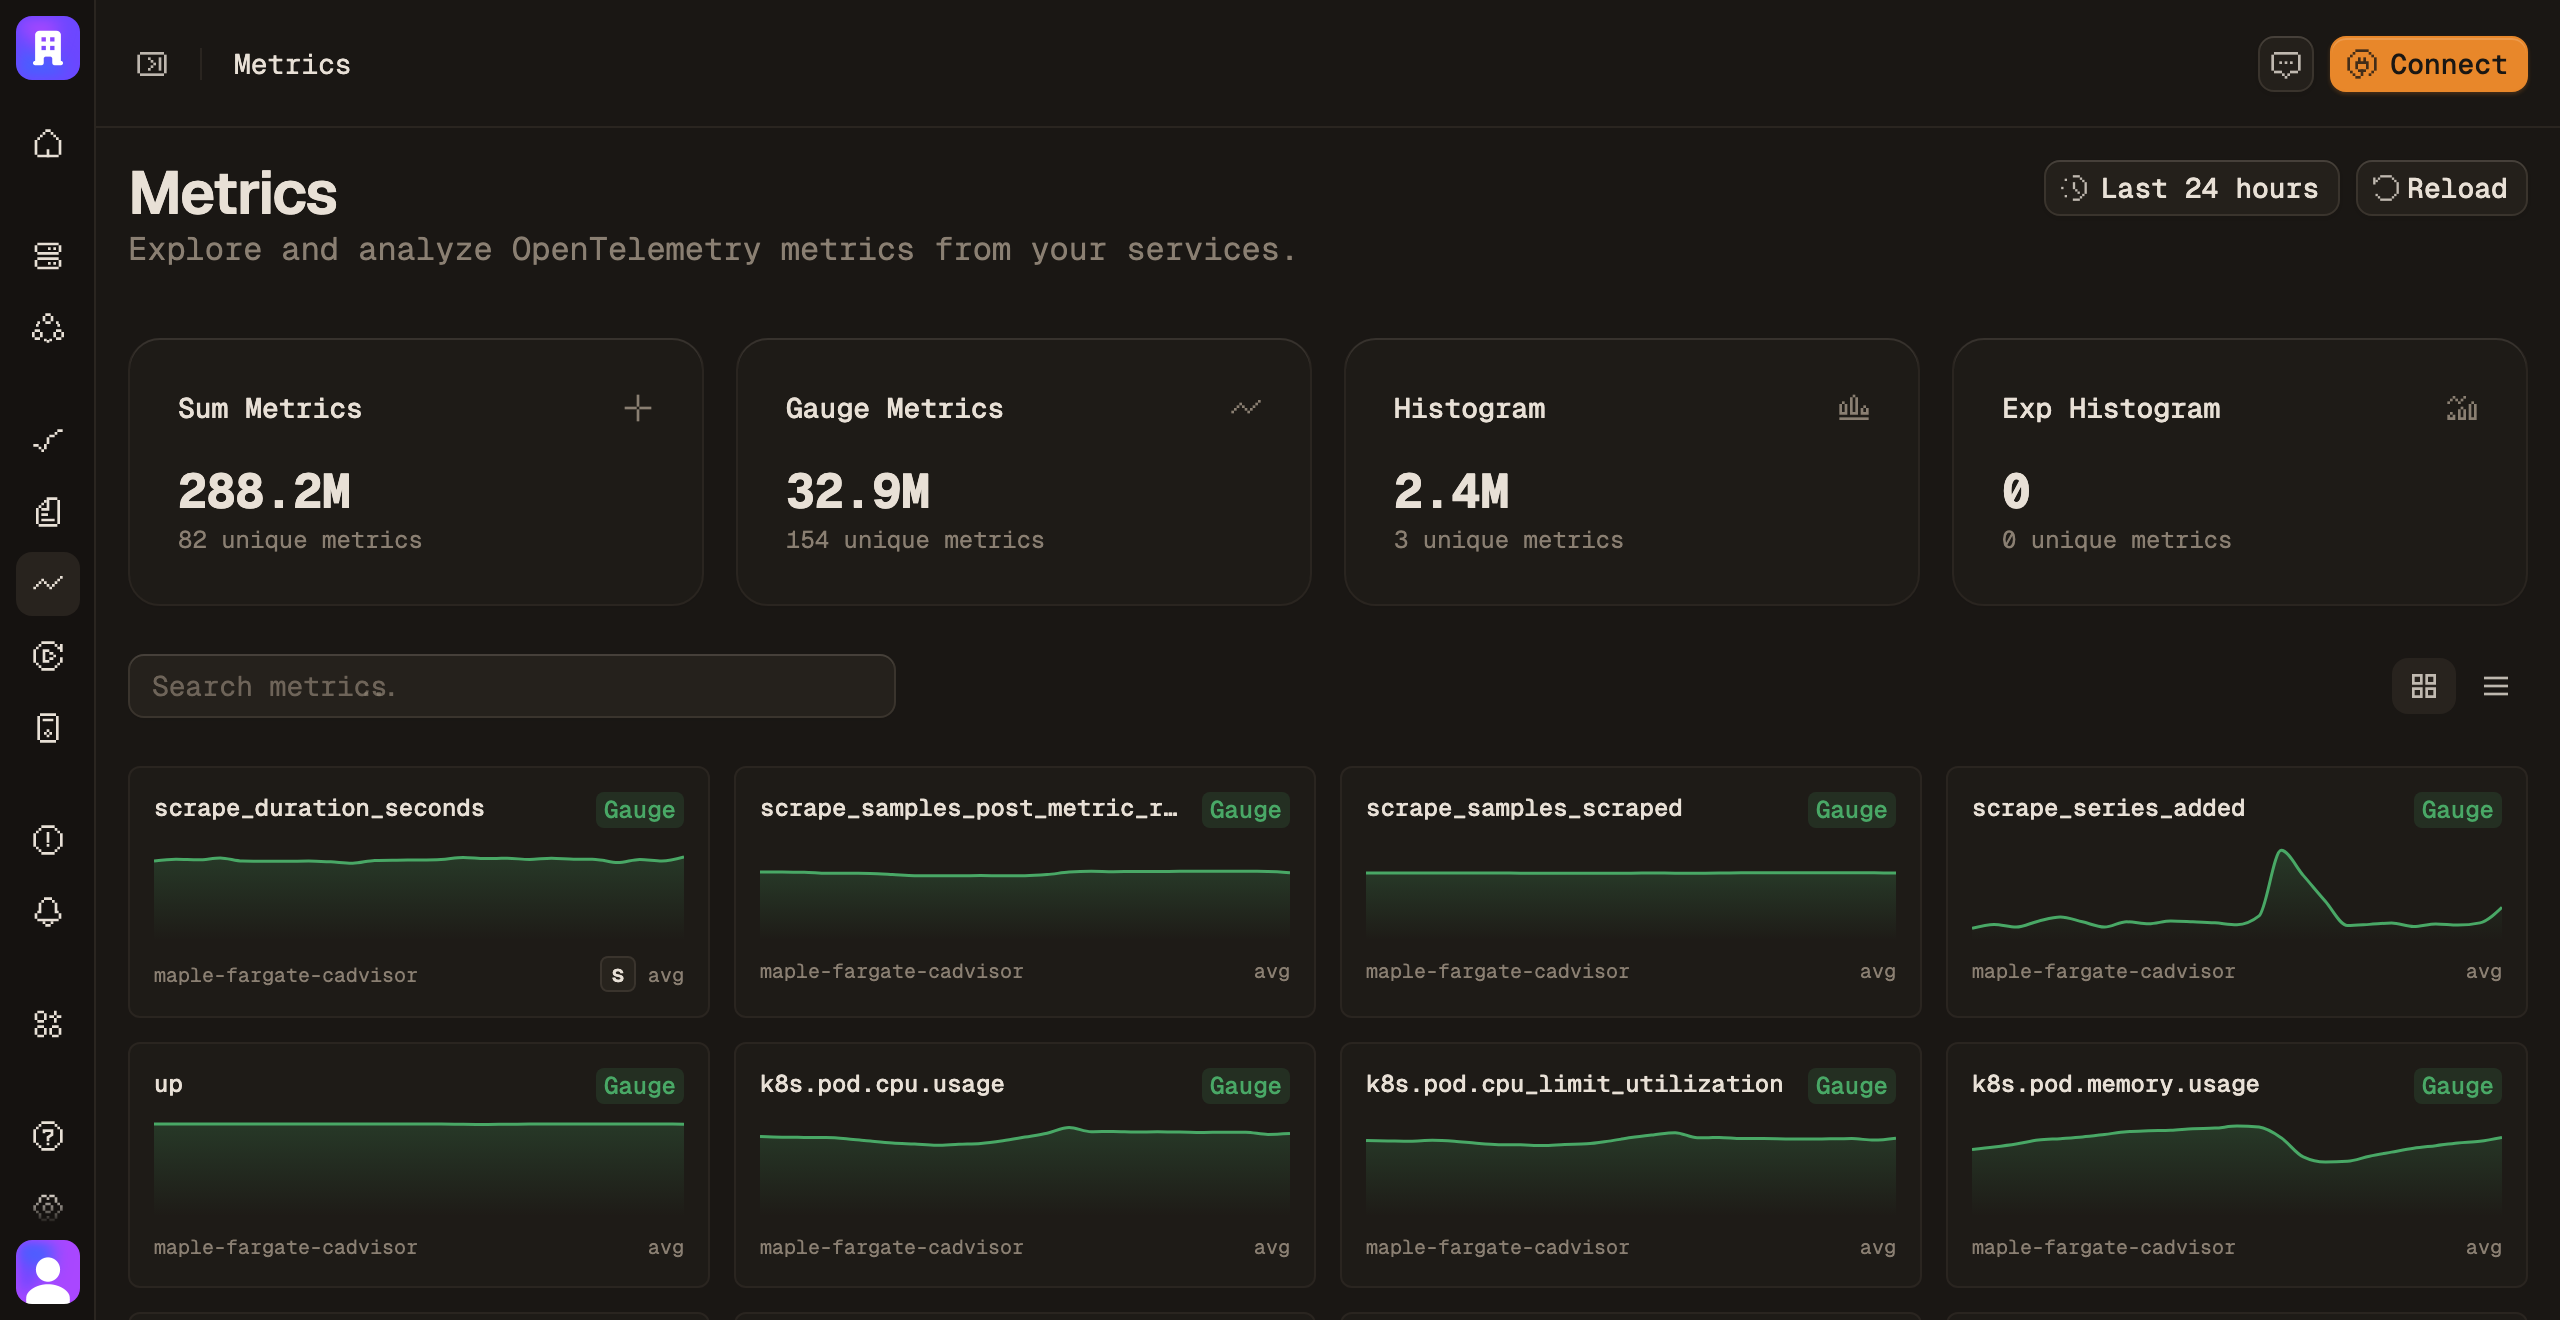
Request rate, error rate, latency percentiles. Build the board yourself, or ask the agent to build it.

The metric explorer listing every metric with its type and cardinality
Metrics & Dashboards →

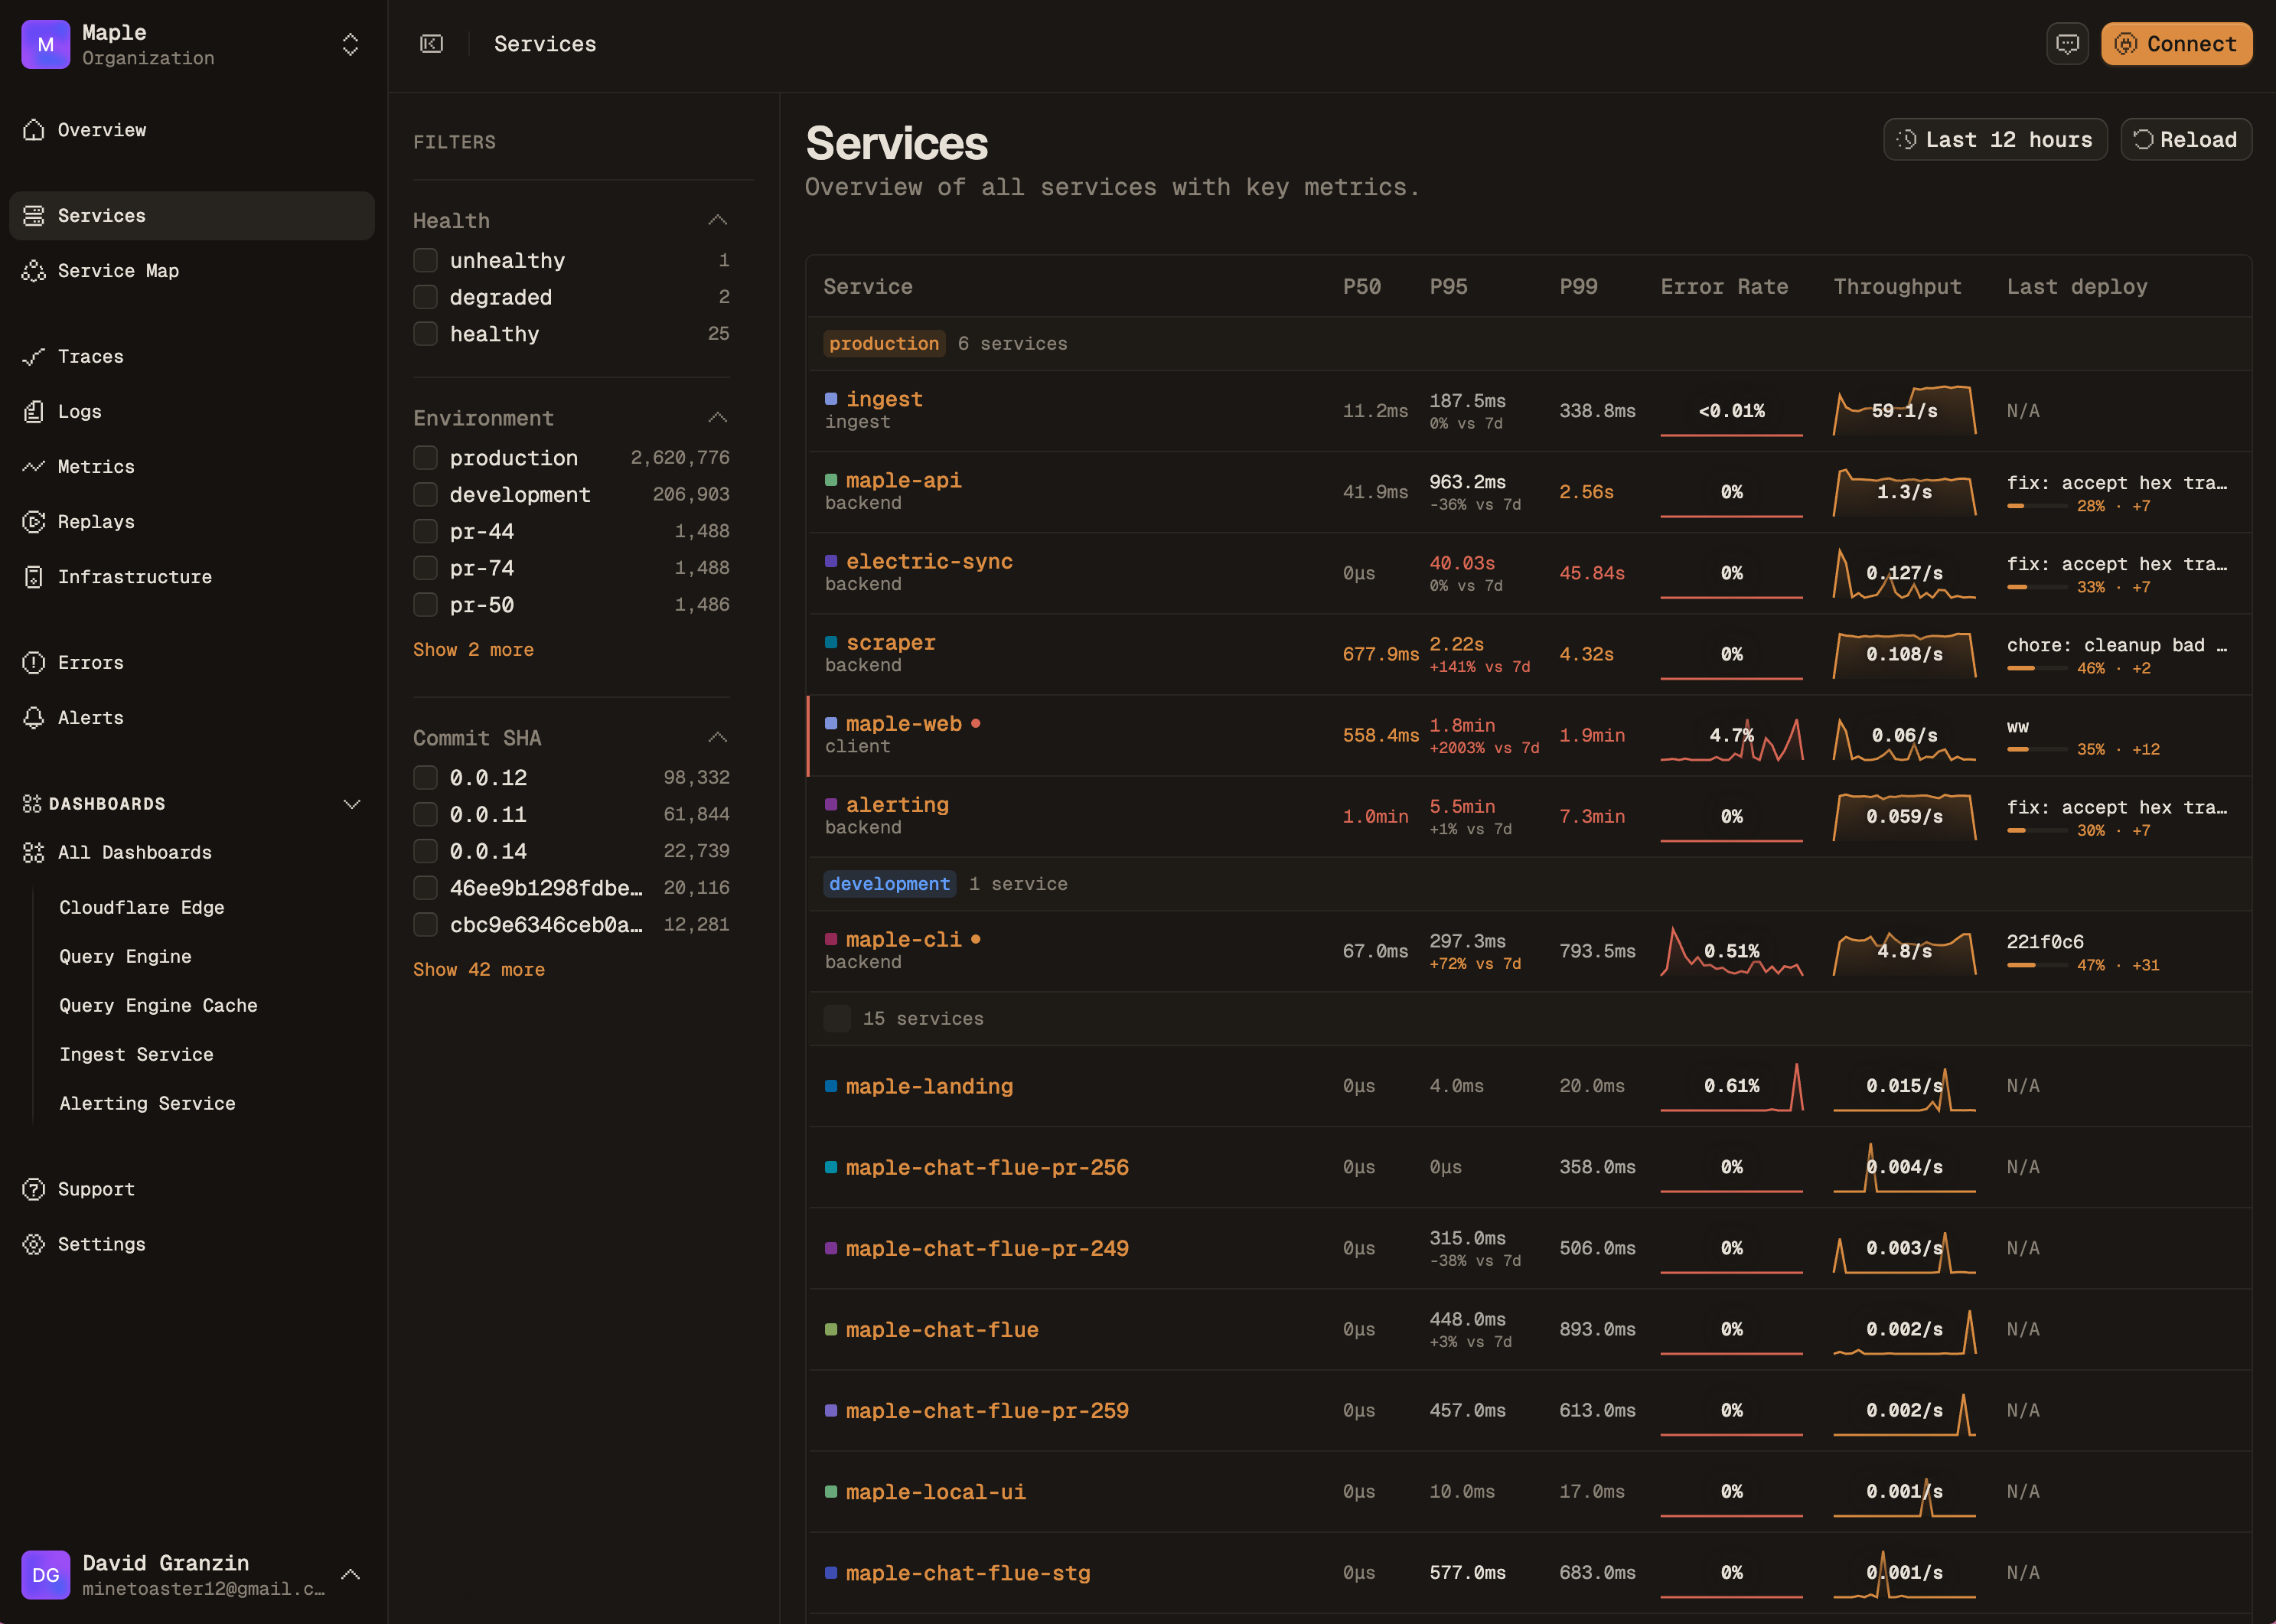
Service map

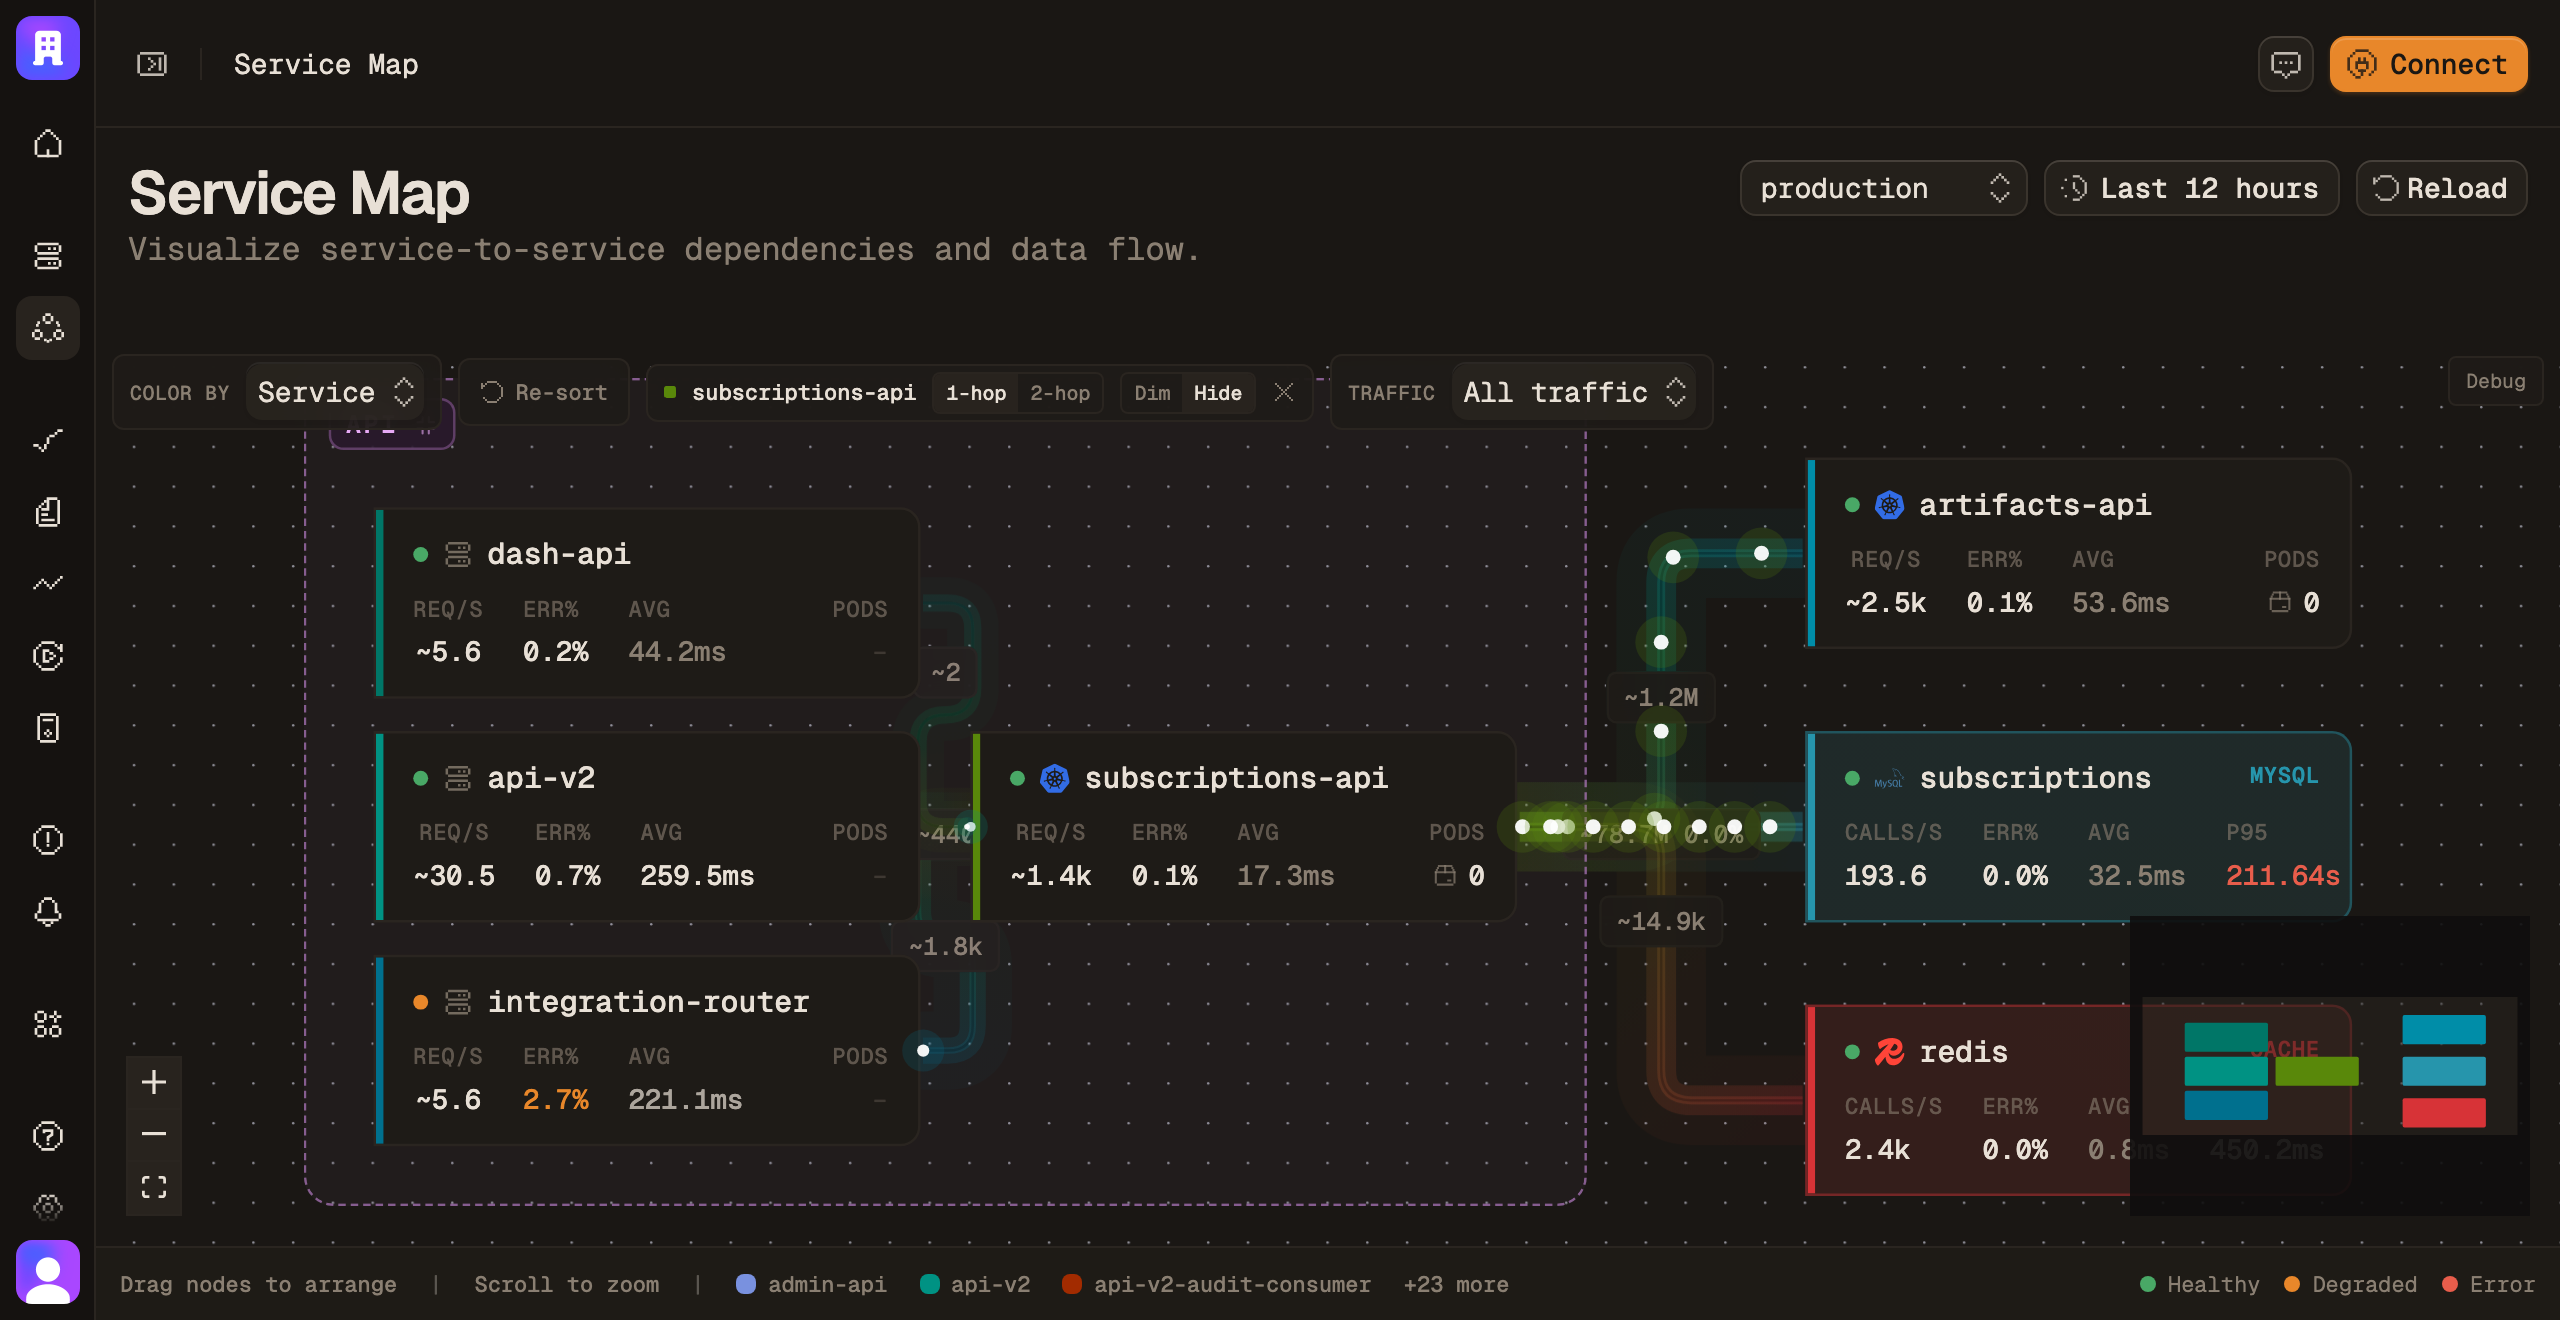
Live request flow between your services. When one fails, you see what it takes down with it.

A focused service neighborhood showing API, database, and cache dependencies with live request flow
Service Catalog & Map →

Error tracking

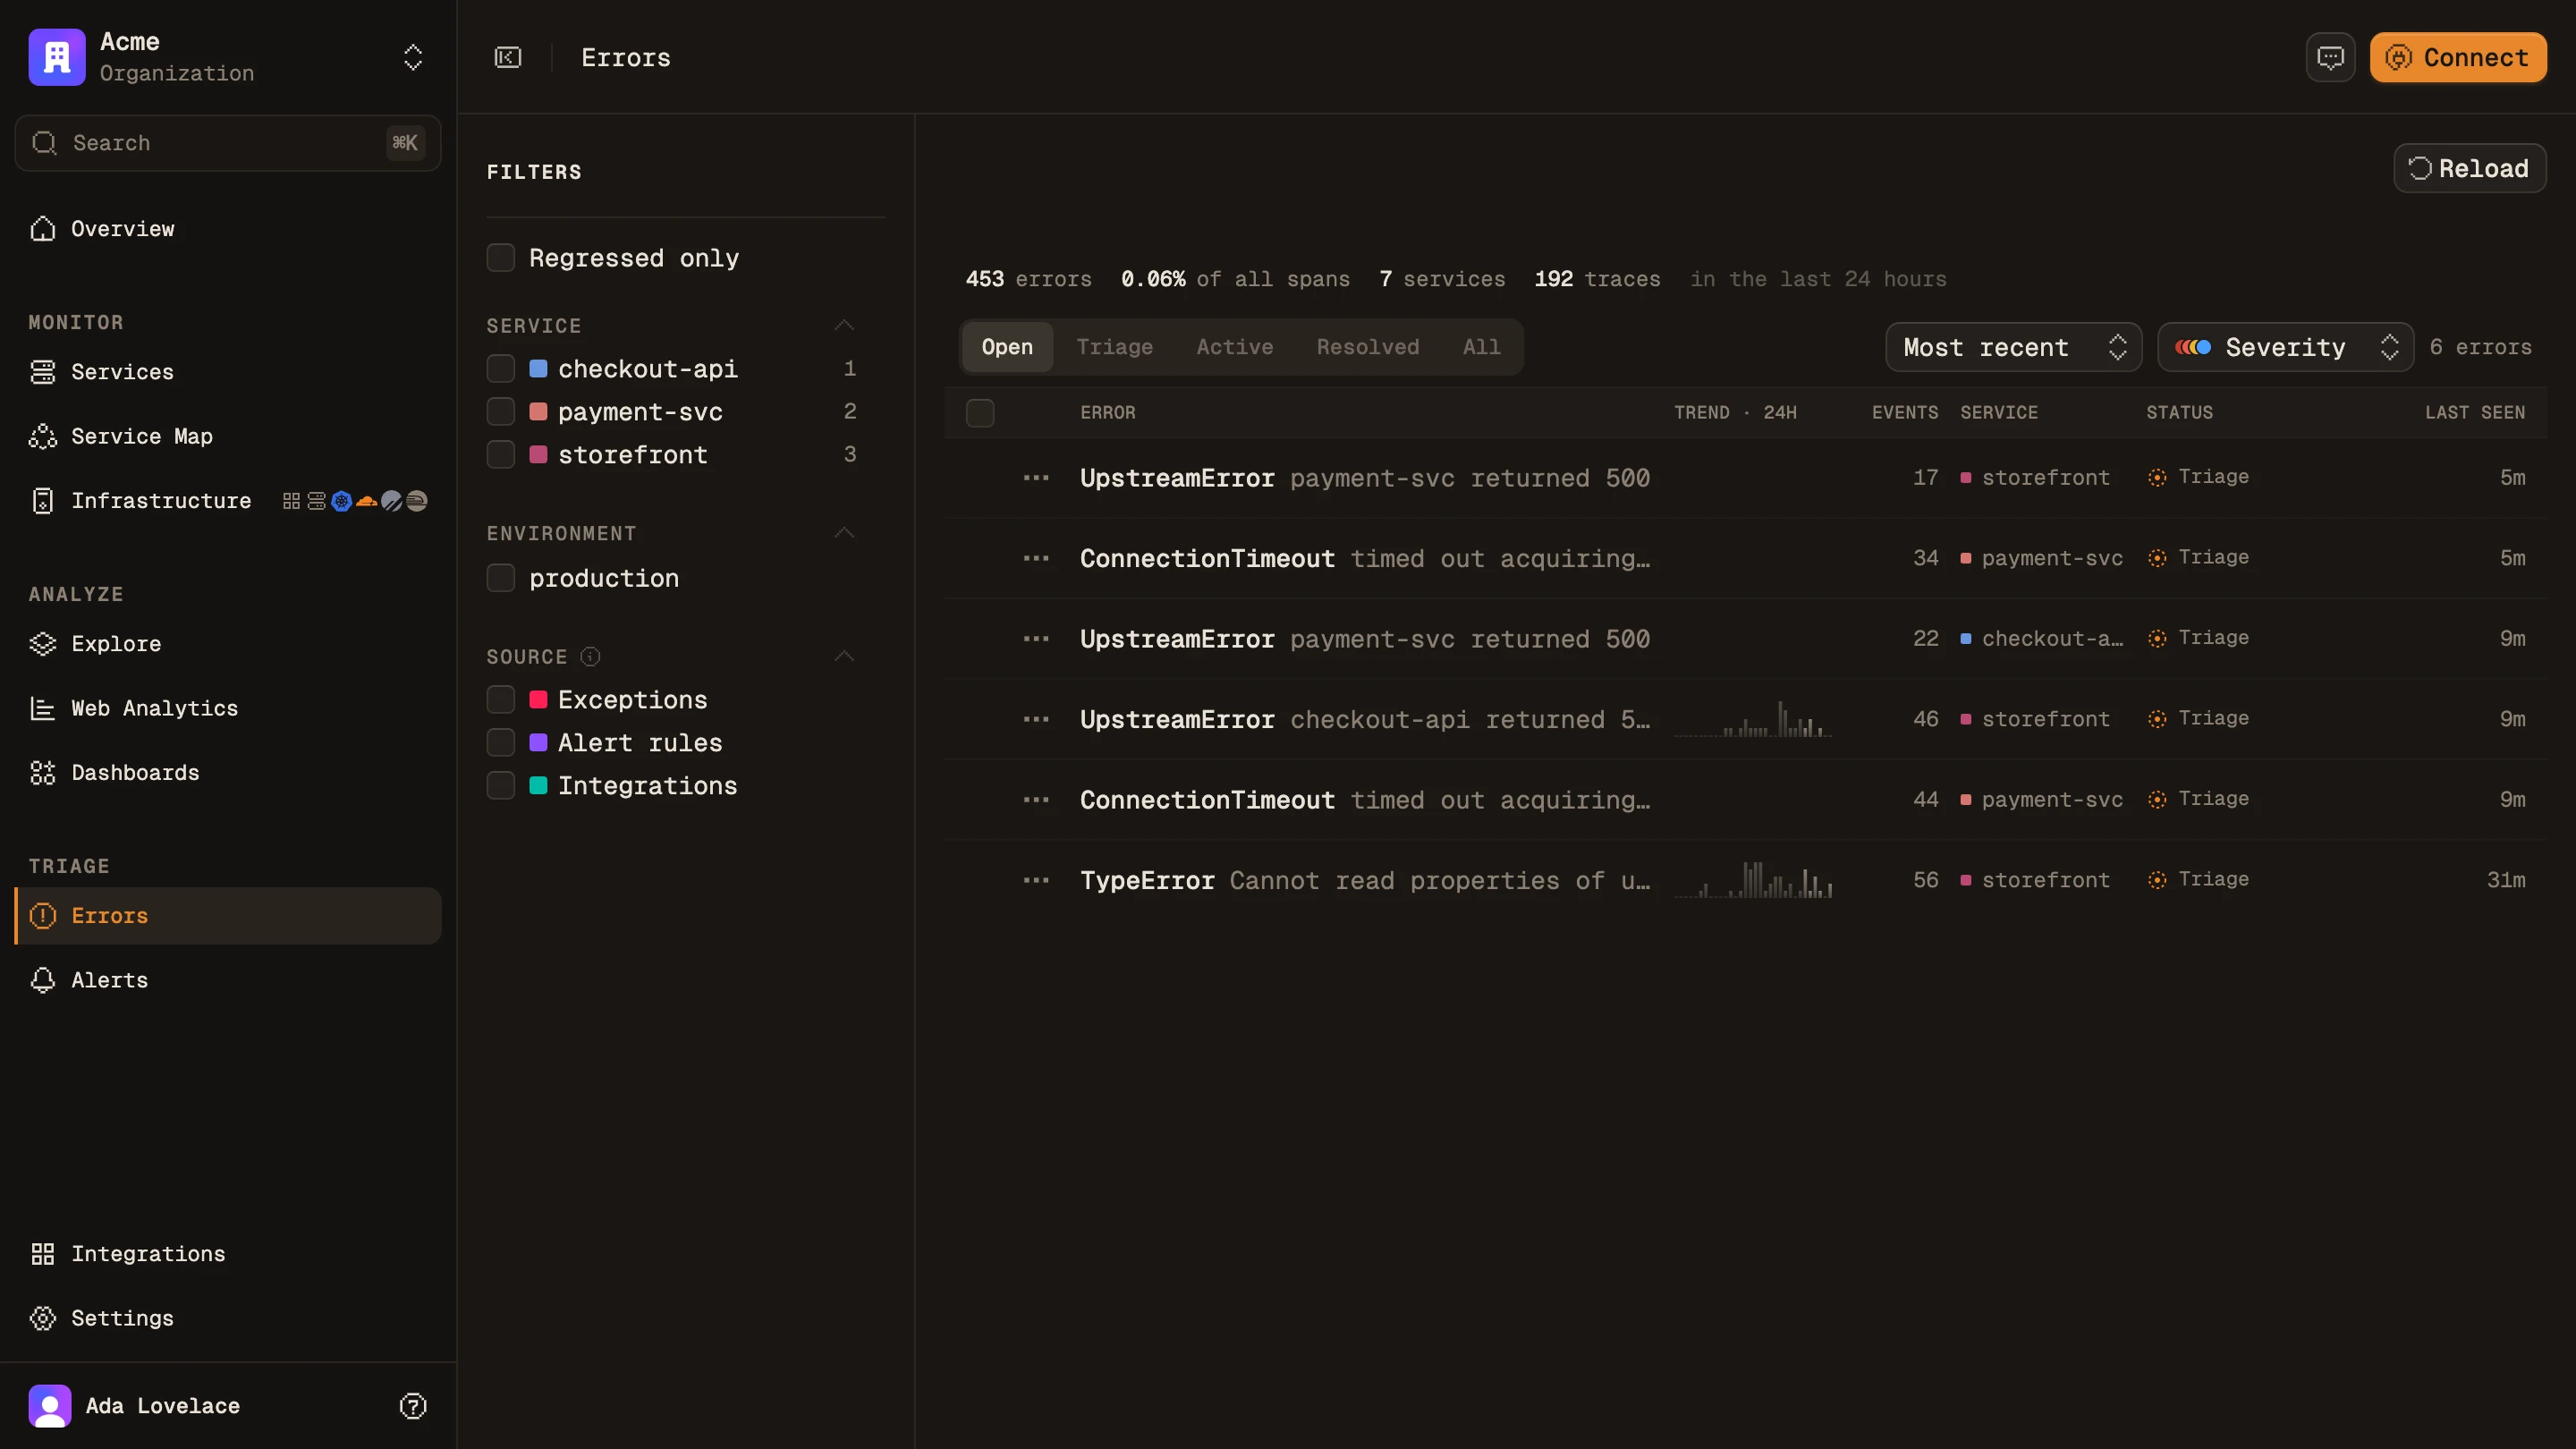
Errors grouped by type across every service, with trends over time, affected services and sample traces attached.

Errors grouped by type with counts, affected services and last-seen times
Error Tracking →

Alerting & on-call

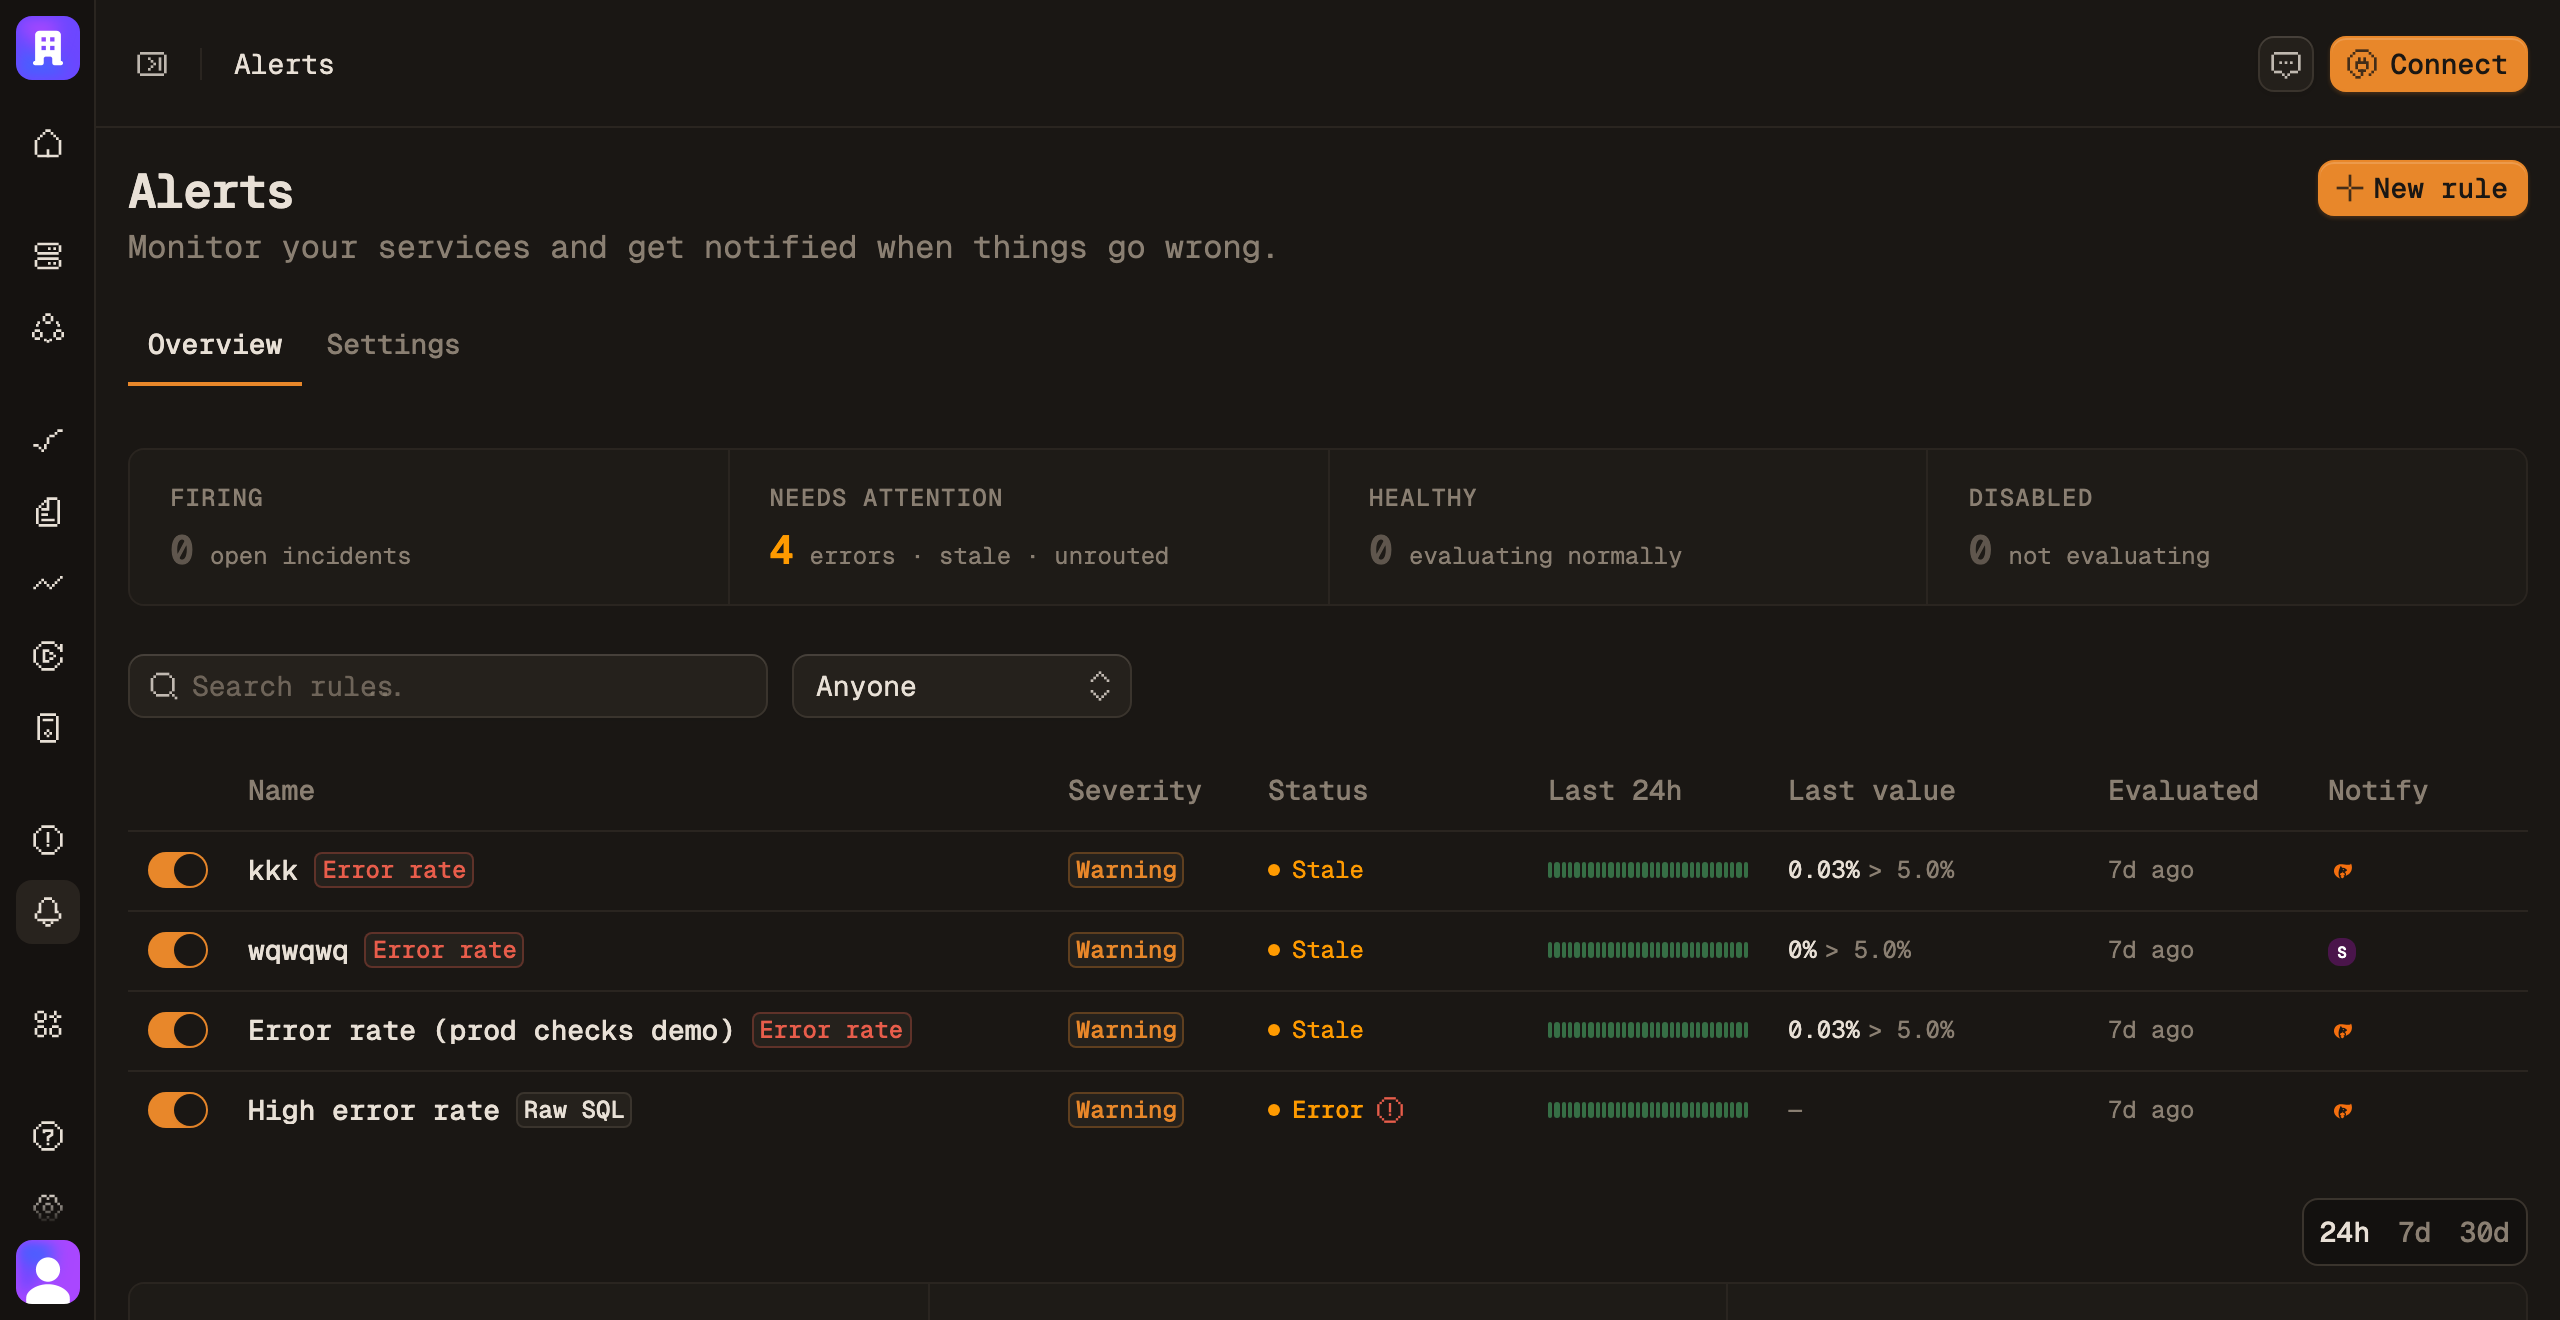
Alert on error rate, latency, Apdex, throughput, any query-builder chart or raw SQL. Escalation chains and on-call schedules decide who is notified next. Routed to Slack, Microsoft Teams, Google Chat, Discord, Telegram, PagerDuty, incident.io, email or any webhook.

Alert rules with severity, signal type and current state
Alerting →

AI & MCP

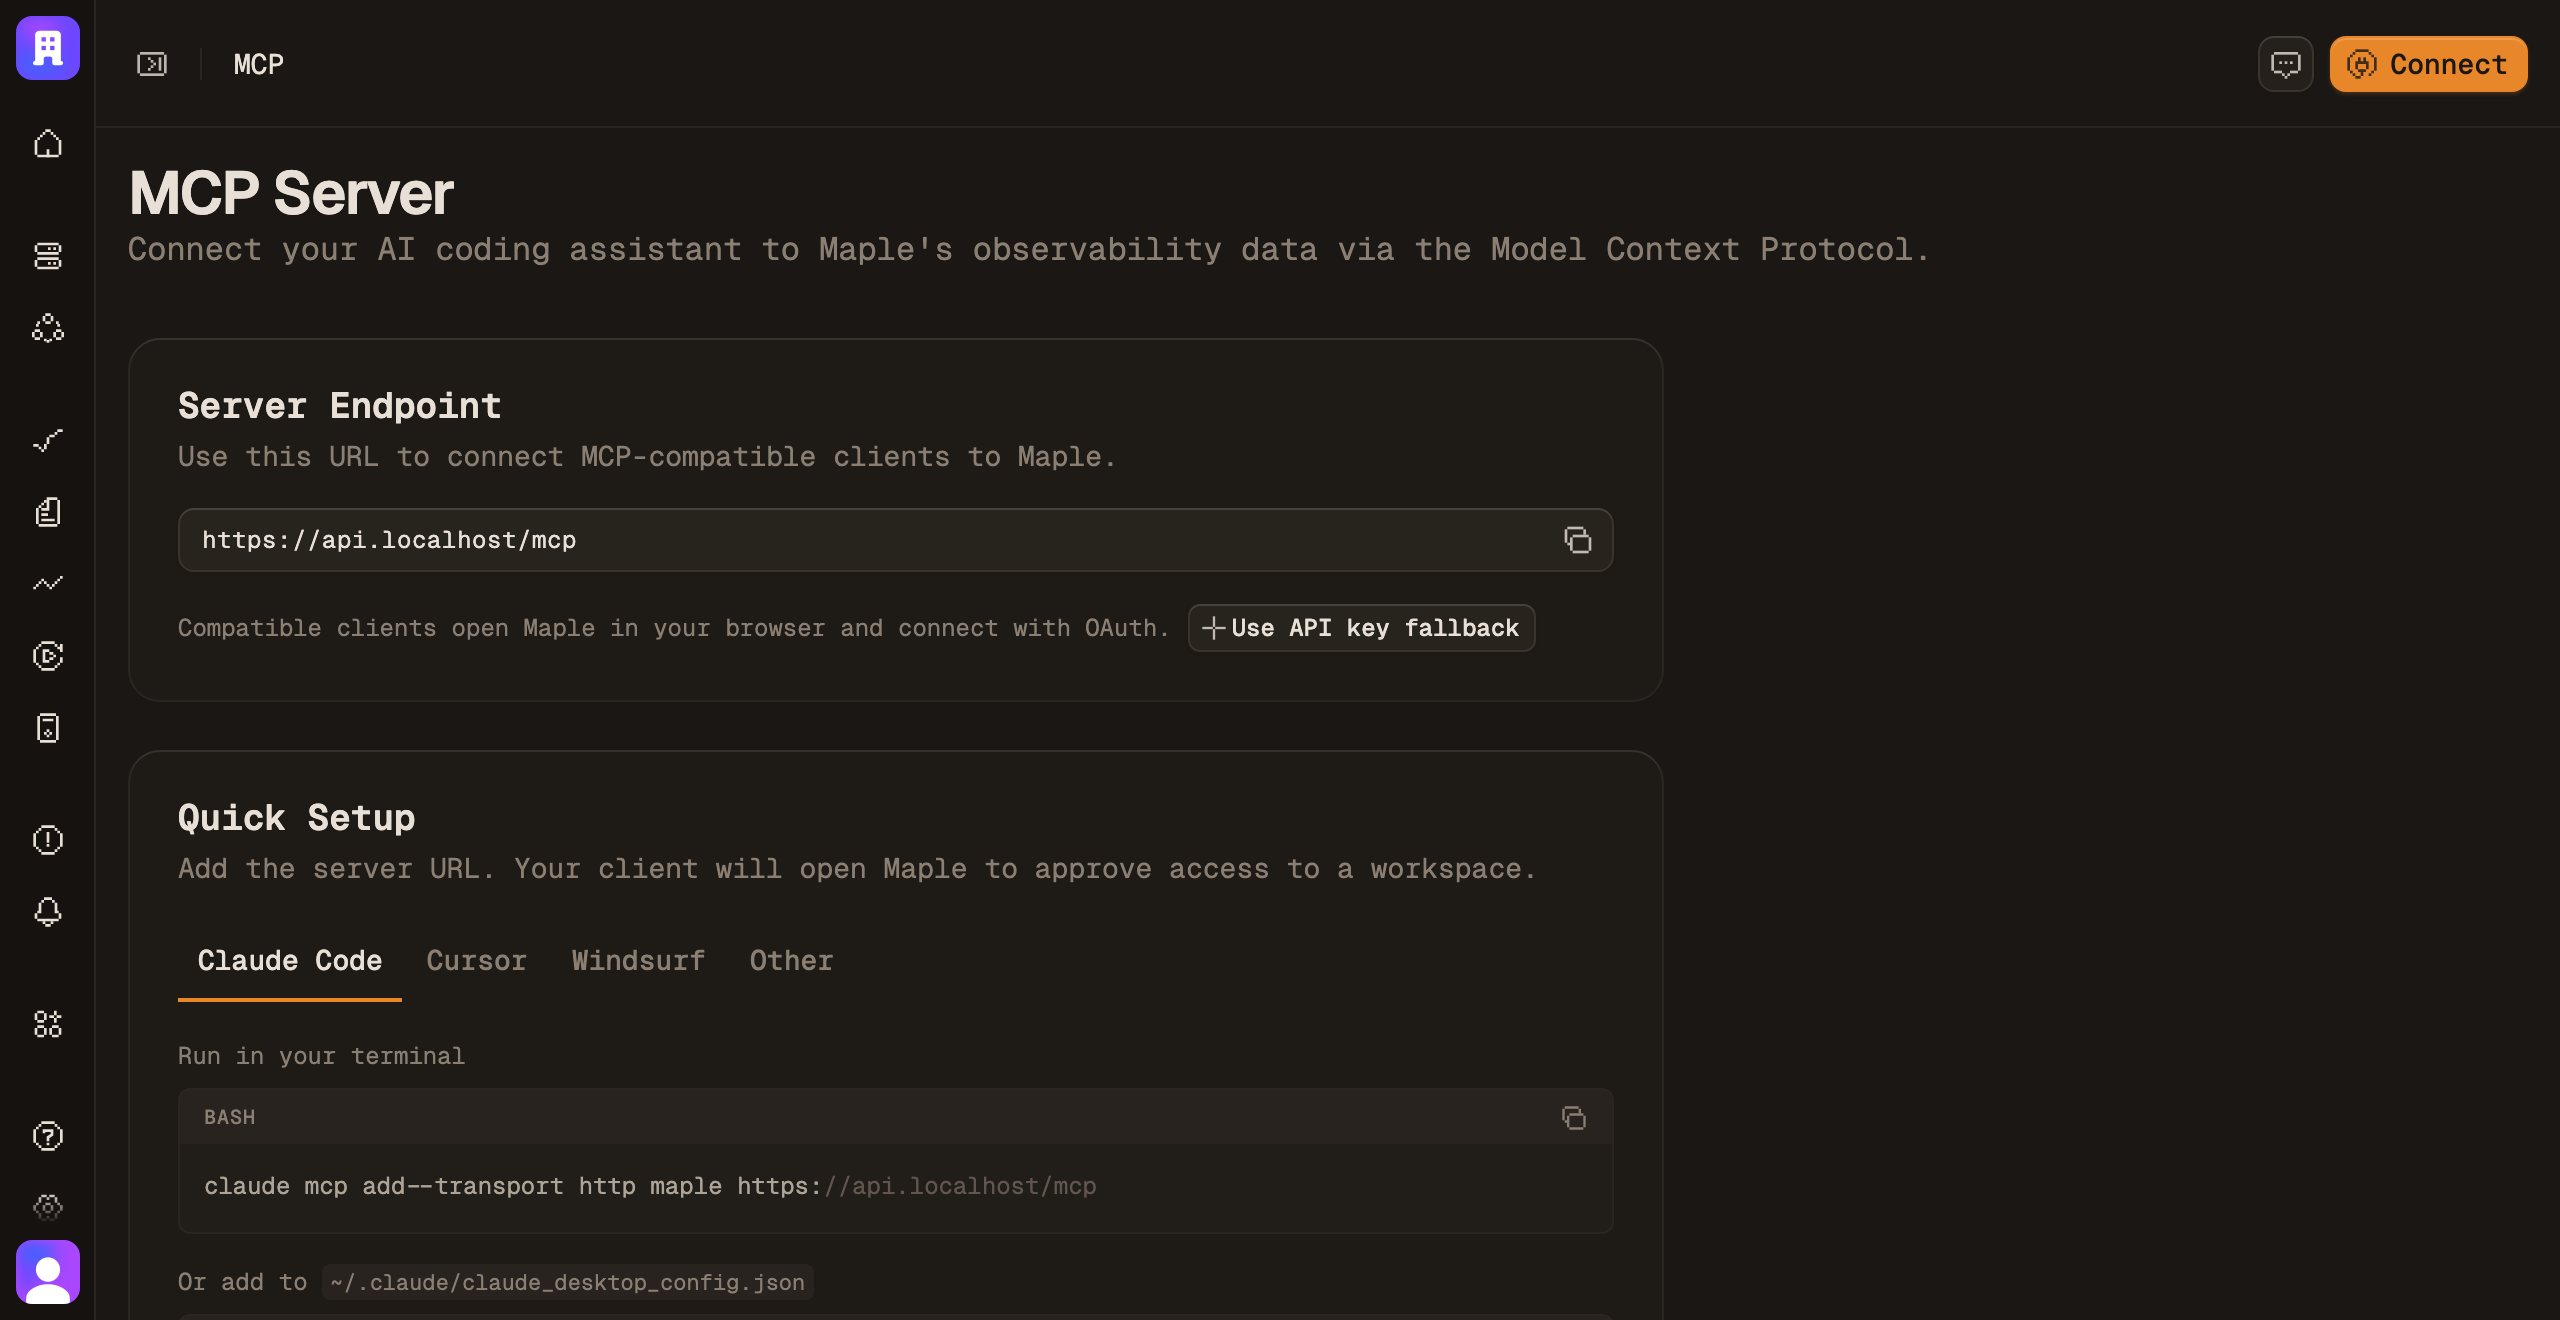
A hosted MCP server behind OAuth. Your agent reads the same traces, logs and errors you do.

The MCP server page with endpoint and client setup
AI & MCP Integration →

Cloud & Kubernetes

Kubernetes monitoring installs with one Helm chart. PlanetScale, Cloudflare, GitHub and the rest connect with one OAuth grant.

Kubernetes Monitoring →
Sovereignty

Your data, your instrumentation, your bill.

OpenTelemetry in, no proprietary agent, and the source on GitHub the whole time. You can leave with everything you brought.

Source available
Source on GitHub under FSL‑1.1. Each release becomes Apache 2.0 after two years. Read every line, fork it or self-host it.
OpenTelemetry native
OTLP straight in. No proprietary agent. The instrumentation you write today works with any OpenTelemetry backend tomorrow.
Your perimeter
Run Maple on your own infrastructure as one container with its own storage. Telemetry stays inside your network, and retention is your call. Self-hosting covers one team today, without alerting.
Published pricing
Pay $39/month for 100 GB per signal, then a flat $0.30/GB. No per-host fees. No per-seat fees. The pricing page and your invoice show the same numbers.

Kubernetes

The pod behind the slow span.

Install a Helm chart and cluster metrics start flowing. Opt a namespace in, and a slow request takes you straight to the pod that served it.

One Helm chart
A small chart you can read in full.
Pods linked to spans
Go from a slow trace to the pod and node that ran it.
Cluster-state metrics
Deployments, replicas and pod status, collected by the chart.
$ helm install maple-k8s-infra maple/k8s-infra
pod heatmap · 192 pods · cluster cpu 44% DEMO
PODS 192
RUNNING 184
DEGRADED 6
FAILING 2
HOT >78% 11
default default 72
observability obs 32
kube-system kube-sys 40
ingress-nginx ingress 24
data data 24
CPU
0% 100% degraded failing

Web analytics

Web analytics from the sessions you already record.

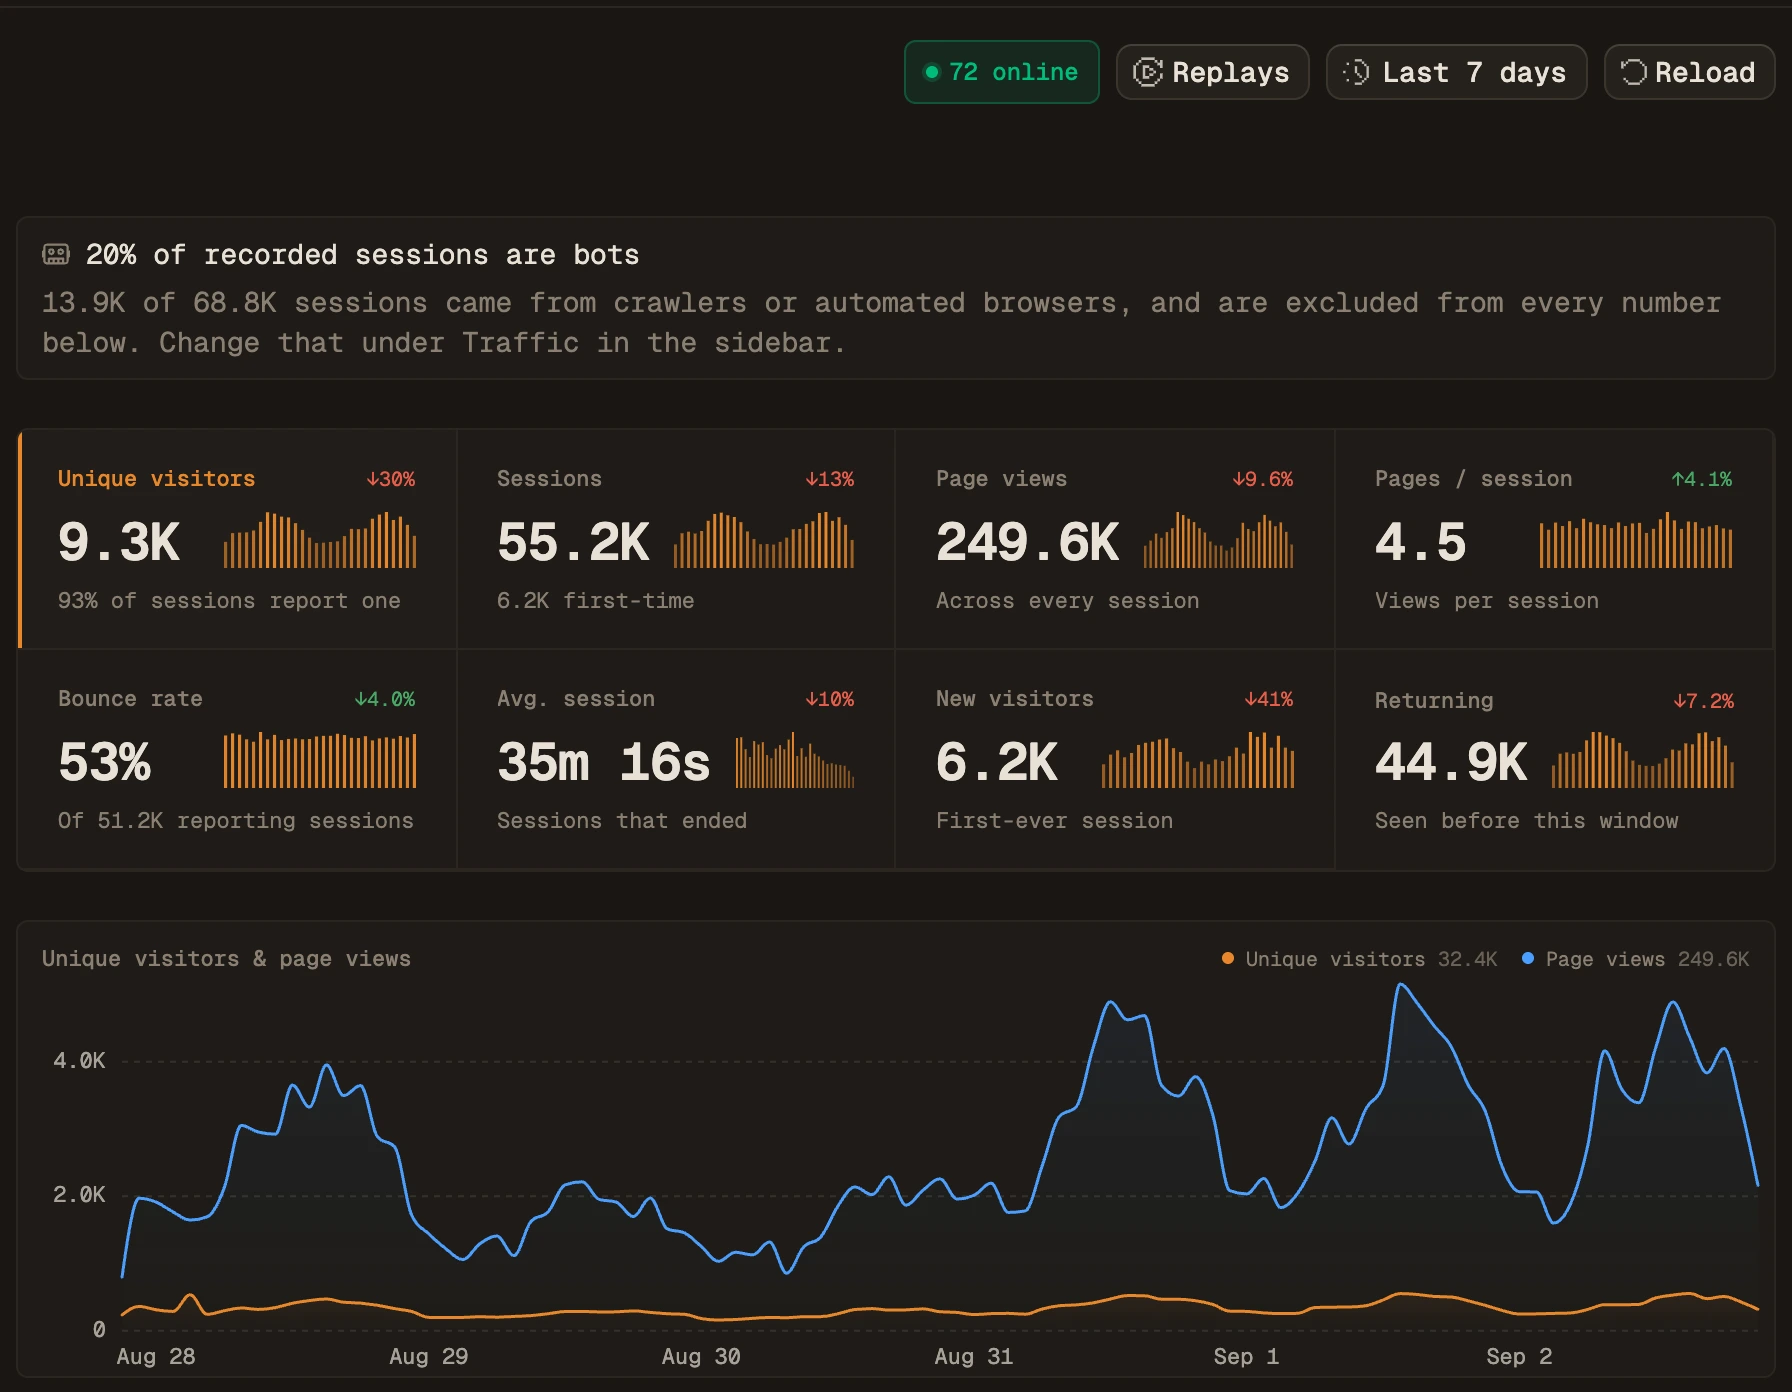
Visitors, page views, referrers, countries, devices. No second script, no second vendor.

One SDK
MapleBrowser.init records the session. Analytics, replay and the trace all read from it.
Bots excluded by default
Crawlers are filtered out and the excluded count is shown.
Every row is a filter
Click a referrer or a country and the page narrows to it. Every session links to its trace.
The Web Analytics page: unique visitors, sessions, page views and bounce rate over the last 7 days, with the live visitor badge and the visitors and page views chart

Product events

Funnels on the telemetry you already send.

Count signups, checkouts and upgrades from the browser, your backend or a span you already emit. See the step where people stop, on the same dashboards as your latency.

Events from your traces
Set maple.product_event.name on a span and it becomes an event, in any language. The event keeps a link to the trace that ran it.
One person, start to finish
An anonymous visit to your site joins the user it signs up as. Funnels count people, not cookies.
1M events included every month
Then $5 per million. Automatic page views are never counted, and every event is kept for 365 days.
funnel · pricing → paid conversion rate 6.4% DEMO
count by person window 24h range 30d
$pageview /pricing 100% 8,412 entered
signup_​started 35.2% 2,961 reached 35.2%
35.2% 64.8%
signup_​completed 26.0% 2,190 reached 74.0%
74.0% 26.0%
plan_​started 6.4% 538 reached 24.6%
24.6% 75.4%
signup_completed → plan_started
→converted538
↓dropped1,652
median time2h 14m
went next/docs/billing · 41%
  • plan_started trace trace 4f9ac21e
  • signup_completed server user u_8124
  • $pageview browser /pricing
uptime · 5 monitors DEMO
status monitor checks p95 30d
DOWN checkout-api GET /health · every 30s 212 ms 99.71%
UP auth GET /v1/session · every 60s 84 ms 99.98%
UP postgres-primary TCP db.internal:5432 · every 30s 3 ms 100%
UP acme.com MX DNS MX acme.com · every 5m 21 ms 100%
UP nightly-backup cron 0 3 * * * · grace 15m n/a 100%
incident opened 14:32:07
checkout-api is down
Status 503, expected 2xx · failed 2 checks in a row
trace 7c1e40a9…e21f service checkout sent to #oncall
failed checks 2/2 · closes when it passes again

Uptime

The trace behind the failed check.

Maple checks your sites, APIs, ports and cron jobs around the clock. When one fails, your team gets the alert with the reason.

HTTP failures come with a trace
Open a failed HTTP check and see what happened inside your instrumented app, down to the slow query.
Alerts where your team works
Slack, PagerDuty, email or a webhook, through the same alerting as the rest of Maple. Resolves itself when the check passes.
Sites, ports, DNS and cron jobs
Check status, speed, body or headers, or have a job ping Maple when it finishes.

Agents

Let an agent run the investigation.

This is the sequence of tool calls an MCP client makes against Maple, from a service list to a proposed patch.

Reads the code behind the trace
The agent pulls the source file behind a span, so the fix it proposes cites your actual code.
Writes back
Claim an issue, set its severity, attach a fix. The agent changes state in Maple as well as reading it.
OAuth, no plugin
Point any MCP client at the endpoint and sign in. Open protocol, nothing to install.
mcp · agent session DEMO
> ask maple
list services that errored in the last 15m
→ list_services { window: "15m", filter: "errors > 0" }
← 3 services
paymentserrors142p992.4s recoserrors38p99840ms shippingerrors6p99320ms
> investigate payments
→ find_errors { service: "payments", window: "15m" }
← 1 issue
stripe.charge declined  ·  142 events  ·  98 users
→ error_detail { issue_id: "iss_8a91" }
← root cause: idempotency key collision
sample trace: trace_9f3c · order 8421
→ propose_fix { issue: "iss_8a91", fix: "scope idempotency_key by user_id" }
← fix attached. opened pr#412.
> 
4 tool calls · 4.2s https://api.maple.dev/mcp

GitHub

Your pull requests, checked against production.

Install the GitHub App and Maple follows each change from the pull request to the hour after it deploys.

GitHub, CI and code review
  1. Before merge

    A review on every push that cites the traffic, errors and alerts behind the lines you changed.

    #1531 AI tab and email preferences with a local send schedule
    6/10 needs attention

    The AI key panel now loses its only Remove path for a lapsed add-on.

    Warning correctness
    Lapsed add-on leaves the saved OpenRouter key with no way to remove it ai-provider-section.tsx:179-181
    migration Safe on production data
    WebAnalyticsDigestService.ts 235 calls/day
  2. In CI

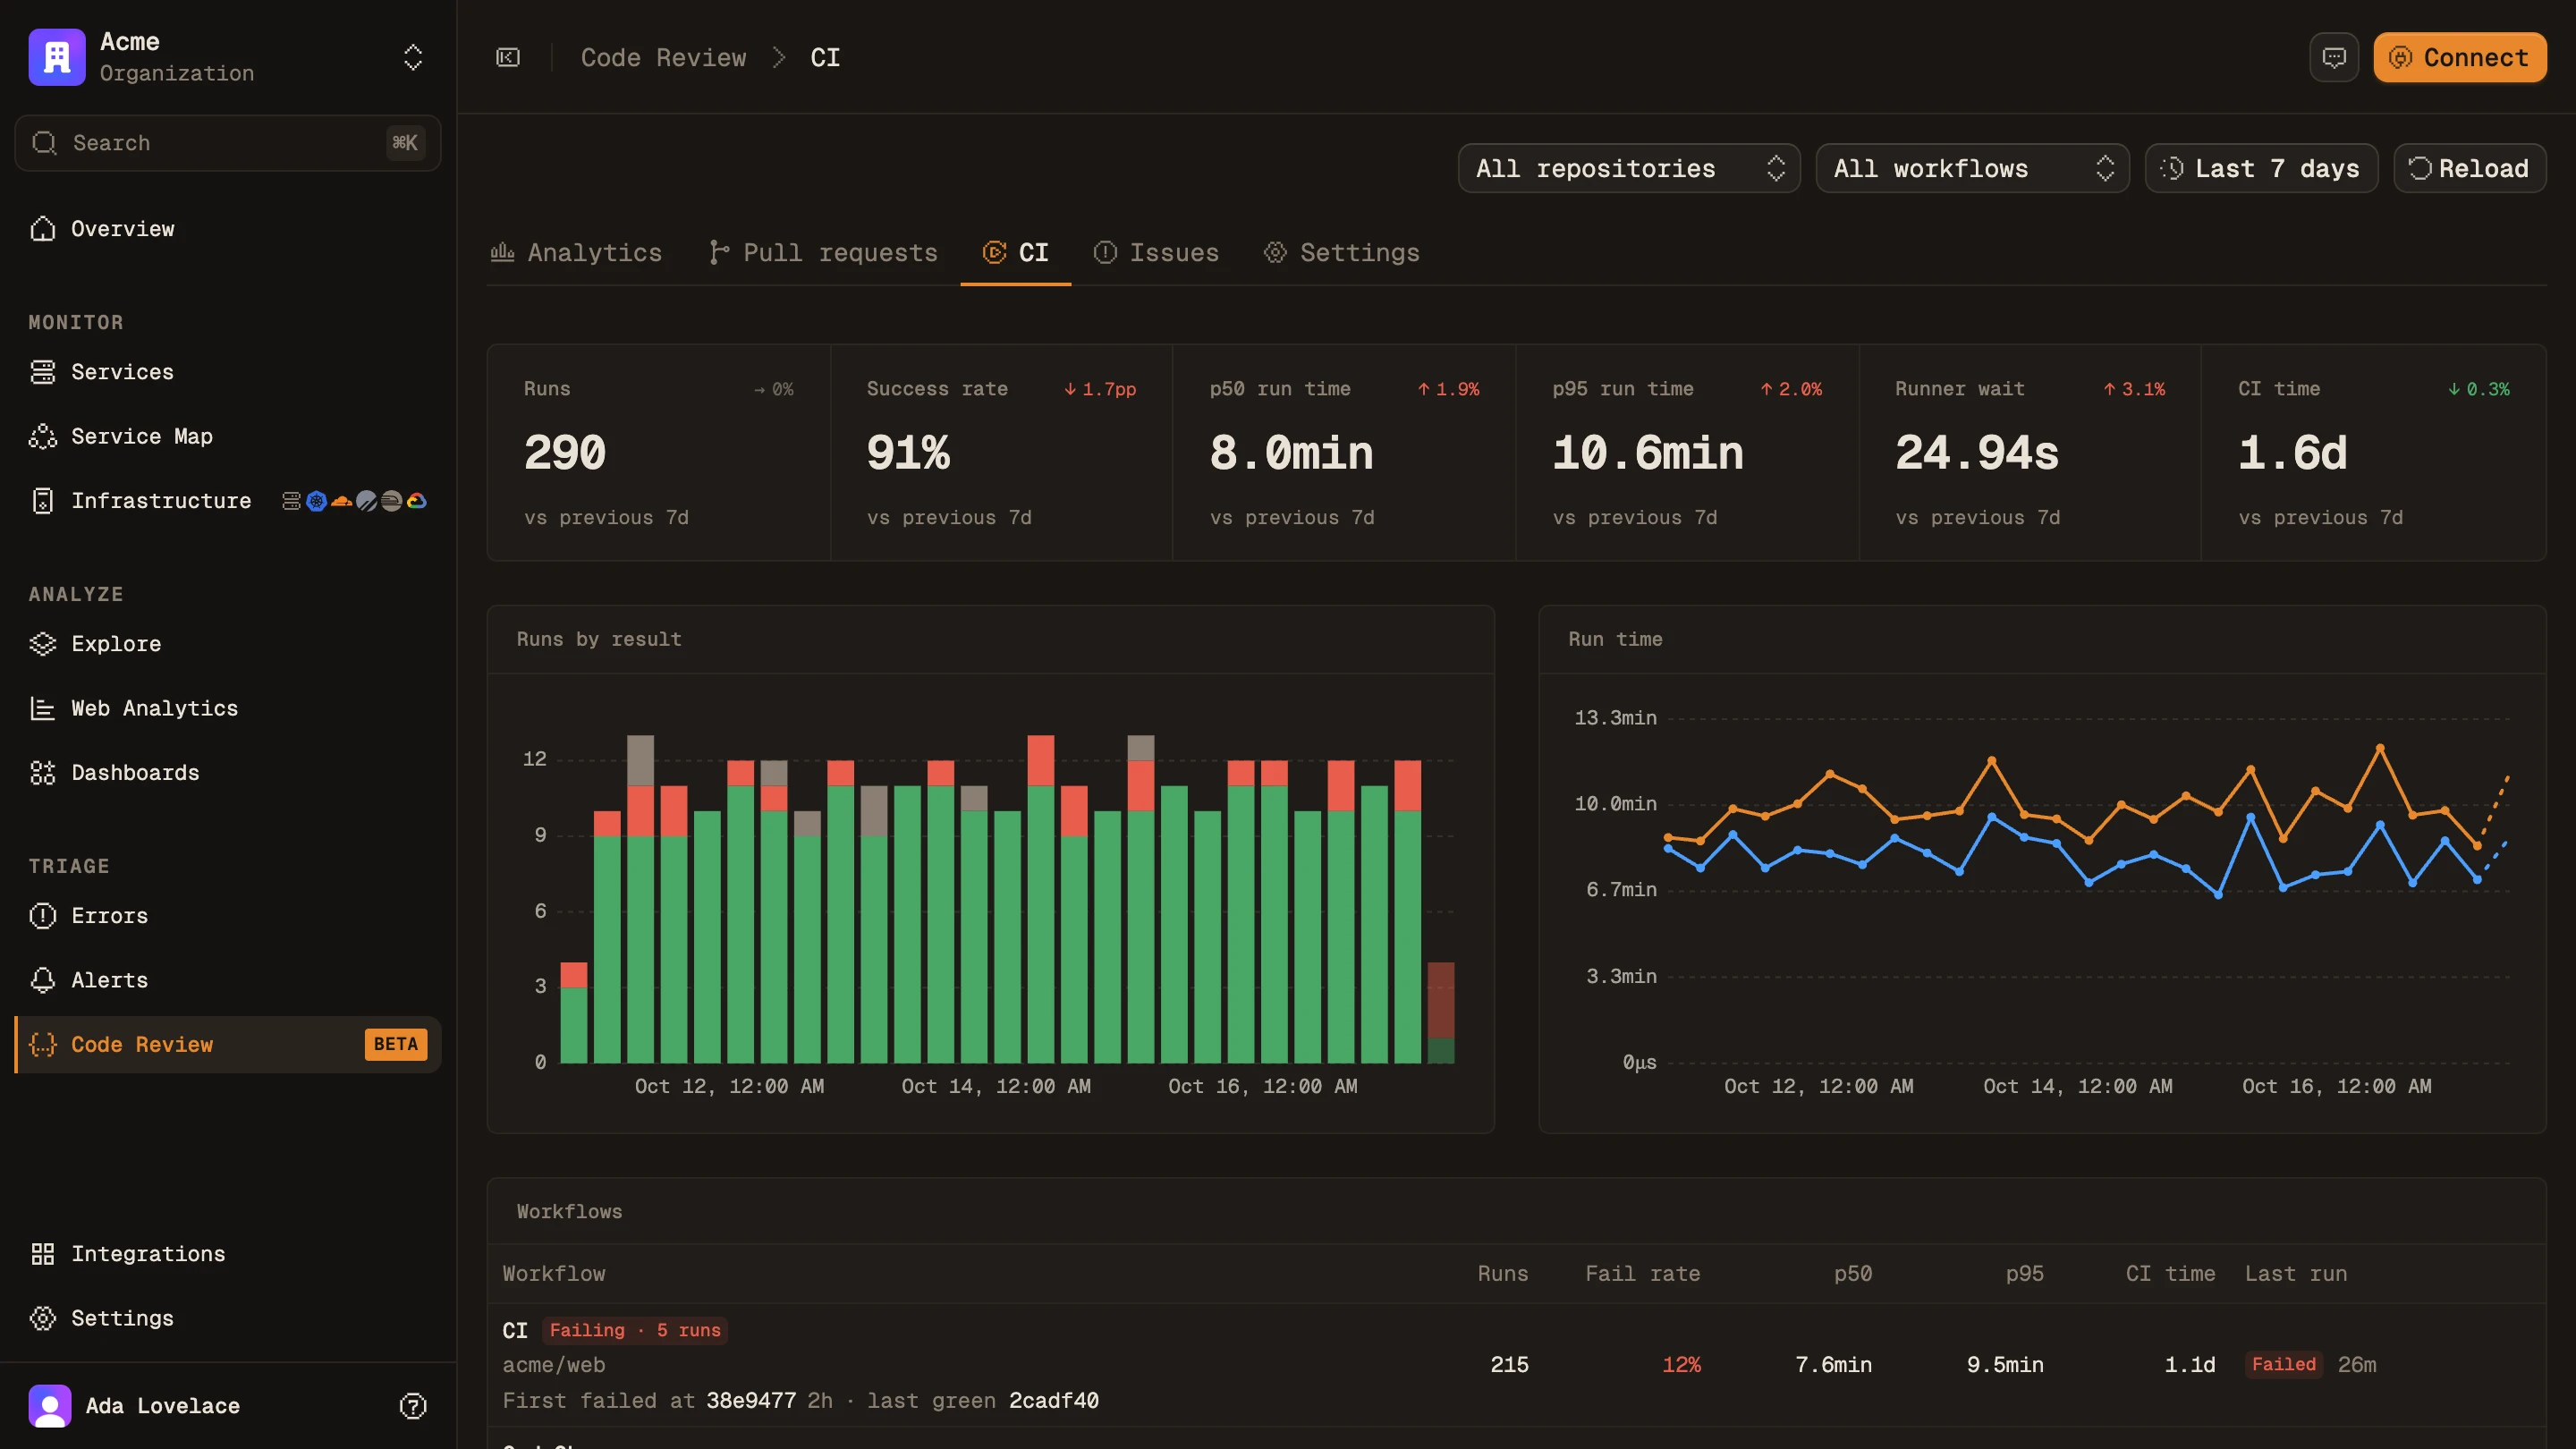
    Every GitHub Actions run becomes a trace: jobs, steps and runner queue time on one waterfall.

    The CI tab's run count, success rate and p50 run time over a chart of runs by result per day
  3. After it ships

    An hour after the deploy, Maple compares the hour before with the hour after and reports back on the pull request.

    #1524 merged deploy d6a5ade · +1 h
    Shipped clean Nothing this change touches got worse in the hour after it deployed.
    operation calls/h p95
    POST /mcp 207 → 218 648 → 547 ms
    GET /mcp 5 → 11 112 → 85 ms
The bill

The bill, line by line.

Each vendor's public list pricing next to Maple's.

Line item Maple Datadog New Relic Grafana Cloud Dash0 SigNoz Axiom Better Stack Honeycomb
Base price $39 / mo None None $19 / mo None $49 / mo, incl. $49 usage $25 / mo None · bundles from $30 $150 / mo (Pro)
Free plan No · 14-day trial 5 hosts, 1-day metrics 100 GB / mo, 1 full user 50 GB logs/traces, 10k series No · 14-day trial No 500 GB / mo, 25 GB stored 3 GB logs, 3 GB traces 20M events / mo
Per-host fee None $15+ / host / mo None None None None None None None
Per-seat fee None None $10 first, then $99–349 / full-platform user / mo $8+ / active-user / mo None None None $29–34 / on-call responder / mo None
Ingest pricing $0.30 / GB per signal $0.10 / GB + $1.70 / M indexed $0.40 / GB $0.55 / GB $0.60 / M spans or logs · $0.20 / M metric points $0.30 / GB · $0.10 / M samples $0.12 / GB + $0.20 / GB-hr $0.10 / GB + $0.05 / GB-mo stored (EU) $3.00 / M events (spans, logs)
Default retention 30d logs/traces · 90d metrics 15d indexed logs 30d logs · 8d traces 30d logs/traces · 13mo metrics 30d spans/logs · 13mo metrics 15d logs/traces · 1mo metrics Configurable · from $0.03 / GB stored 30d in bundles · billed per GB-mo stored 60d events and metrics
OpenTelemetry support Native Yes Yes Yes Native Native Native Native Native
License FSL-1.1 → Apache 2.0 Proprietary Proprietary AGPL components Proprietary MIT + commercial ee/ Proprietary Proprietary Proprietary
Self-host option One team, no alerting No No OSS components No Supported No No Enterprise, own AWS account

Competitor cells summarize public list prices, checked September 2026 (base prices and free plans, November 2026). Check each vendor's pricing page for current numbers. Maple's rate is the published per-GB rate, billed per signal. Use the calculator to project your monthly cost.

Pricing

One plan, billed by the gigabyte.

100 GB each of logs, traces and metrics included, then a flat rate. Nothing metered by host, seat or query.

Startup 14-day trial
$39 /month

Every feature is included.

$0
per host
$0
per seat
$0
per query
Start 14-day free trial

Free for 14 days · Cancel anytime · Card required to start

Hosted in the US or the EU (Frankfurt) at the same price. EU hosting

Included every month
Logs
100 GB
then $0.30 / GB
Traces
100 GB
then $0.30 / GB
Metrics
100 GB
then $0.30 / GB
Browser Sessions
5,000
then $0.002 / session
Product Events
1M
then $5.00 / 1M events
AI usage
$10
then billed per model, by tokens used

30 days of traces and logs, 90 of metrics · Private support channel · Unlimited dashboards · Advanced alerting · MCP server · AI error triaging · Full API access

Estimate your bill →
Enterprise

Higher volume, custom retention, priority support.

Works with every language OpenTelemetry supports

FAQ

Common questions

What is Maple?
Maple is an observability platform for traces, logs, metrics, errors, session replay, uptime checks and on-call, built on OpenTelemetry and backed by ClickHouse. You collect, query and visualize telemetry from your systems in one app, or let an AI agent do it for you over MCP.
Is Maple open source?
Maple is source available. The code is on GitHub under the Functional Source License (FSL-1.1): you can read every line, fork it and self-host it, but not offer it as a competing commercial service. Each release becomes Apache 2.0 two years after publication.
Is Maple OpenTelemetry-native?
Yes. Maple is built on OpenTelemetry, the open, vendor-neutral standard for telemetry, so there are no proprietary agents. If you already emit OpenTelemetry data, you can point it at Maple without re-instrumenting your code.
How is Maple priced?
The Startup plan is $39/month with 100 GB each of logs, traces and metrics included, then a flat $0.30 per GB. No per-host or per-seat fees. Enterprise plans add custom volume and retention.
Does Maple work with AI agents?
Yes. Maple runs an MCP (Model Context Protocol) server, so compatible AI agents can list services, search traces, find errors and propose fixes directly against your telemetry.
Can I self-host Maple?
Yes. Run the Maple container on your own server with a persistent volume. It bundles ingest, the dashboard and its own storage, for one team and without alerting. Maple Cloud is there for teams that need alerting, team accounts, or would rather not operate it.
Where is my data stored?
Maple Cloud runs in two regions: the United States and the European Union (Frankfurt, Germany). You choose one when you create your organization, and all of its telemetry is stored and processed there. The region cannot be changed later. Pricing is the same in both. To keep the data inside your own network, self-host Maple.

Try it on your own traces.

14-day free trial, card required, no charge until it ends. Or self-host, or run maple start locally with no account at all.